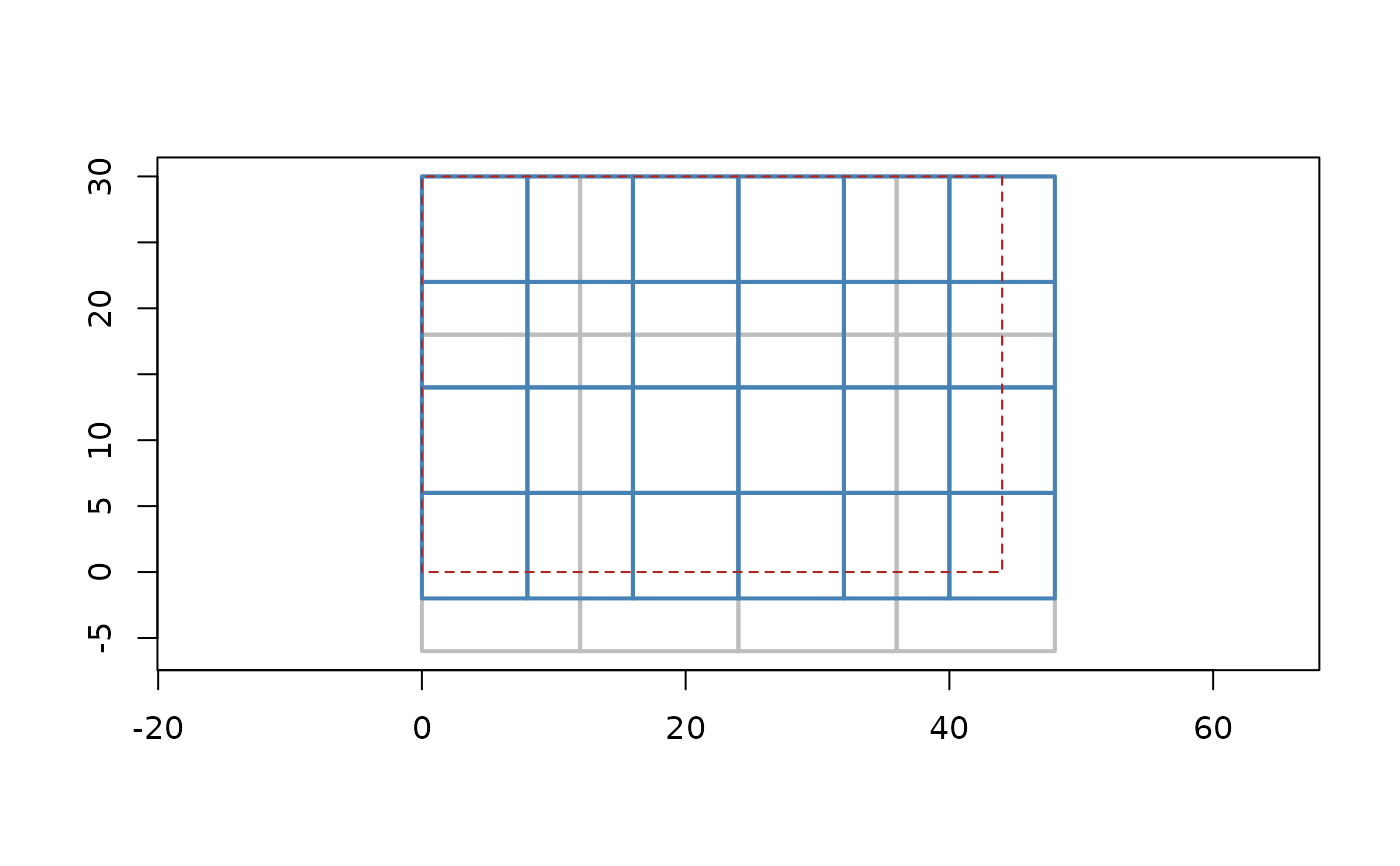
Draws each tile as a rectangle (grey border) with the original raster extent overlaid as a dashed red outline.
# S3 method for class 'grout_tiles'
plot(x, ..., add = FALSE, border = "grey", lwd = 2)
Arguments
Value
the input 'x', invisibly
Draws each tile as a rectangle (grey border) with the original raster extent overlaid as a dashed red outline.
# S3 method for class 'grout_tiles'
plot(x, ..., add = FALSE, border = "grey", lwd = 2)the input 'x', invisibly