Print and format for lazyraster.
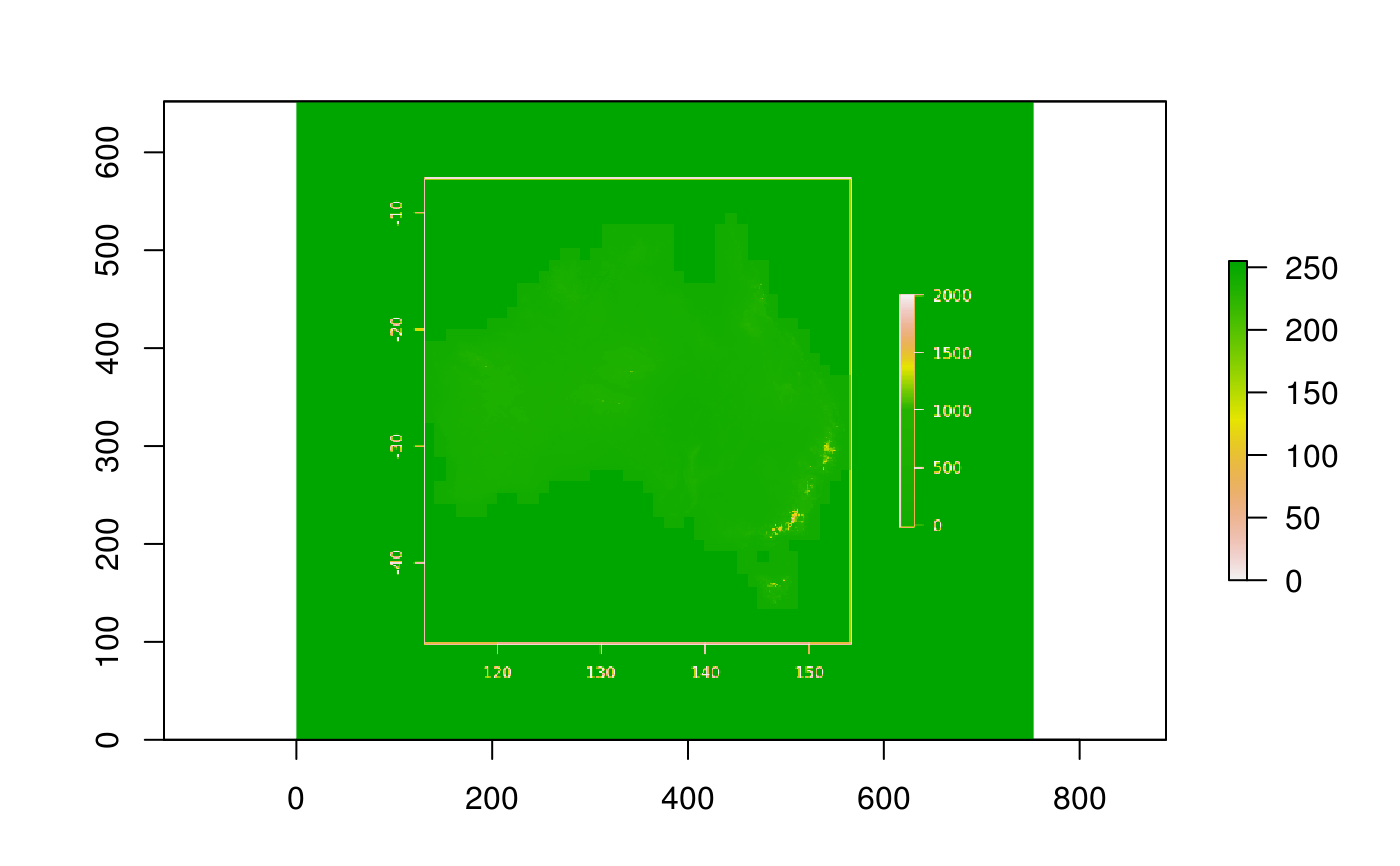
Plot for lazyraster, data pulled on-demand at a reasonable level-of-detail.
# S3 method for lazyraster
print(x, ...)

# S3 method for lazyraster
format(x, ...)

# S3 method for lazyraster
plot(x, y, ...)
Arguments
| x | |
|---|---|
| ... | passed to raster::plot |
| y | ignored |
Details
Data is pulled from the GDAL source at a resolution suited for the currently open graphics device.
Examples
#> Warning: ymin is greater than ymax, switching#> class : LazyRaster #> dimensions : 652, 753 (nrow, ncol) #> resolution : 1.0000, 1.0000 (x, y) #> extent : 0.0000, 753.0000, 0.0000, 652.0000 (xmin, xmax, ymin, ymax) #> crs : <placeholder> #> values : NA, NA (min, max - range from entire extent) #> window extent : <whole extent> #> window index : <-> #> window dimension : (full) (ncol, nrow)#> Warning: ymin is greater than ymax, switching