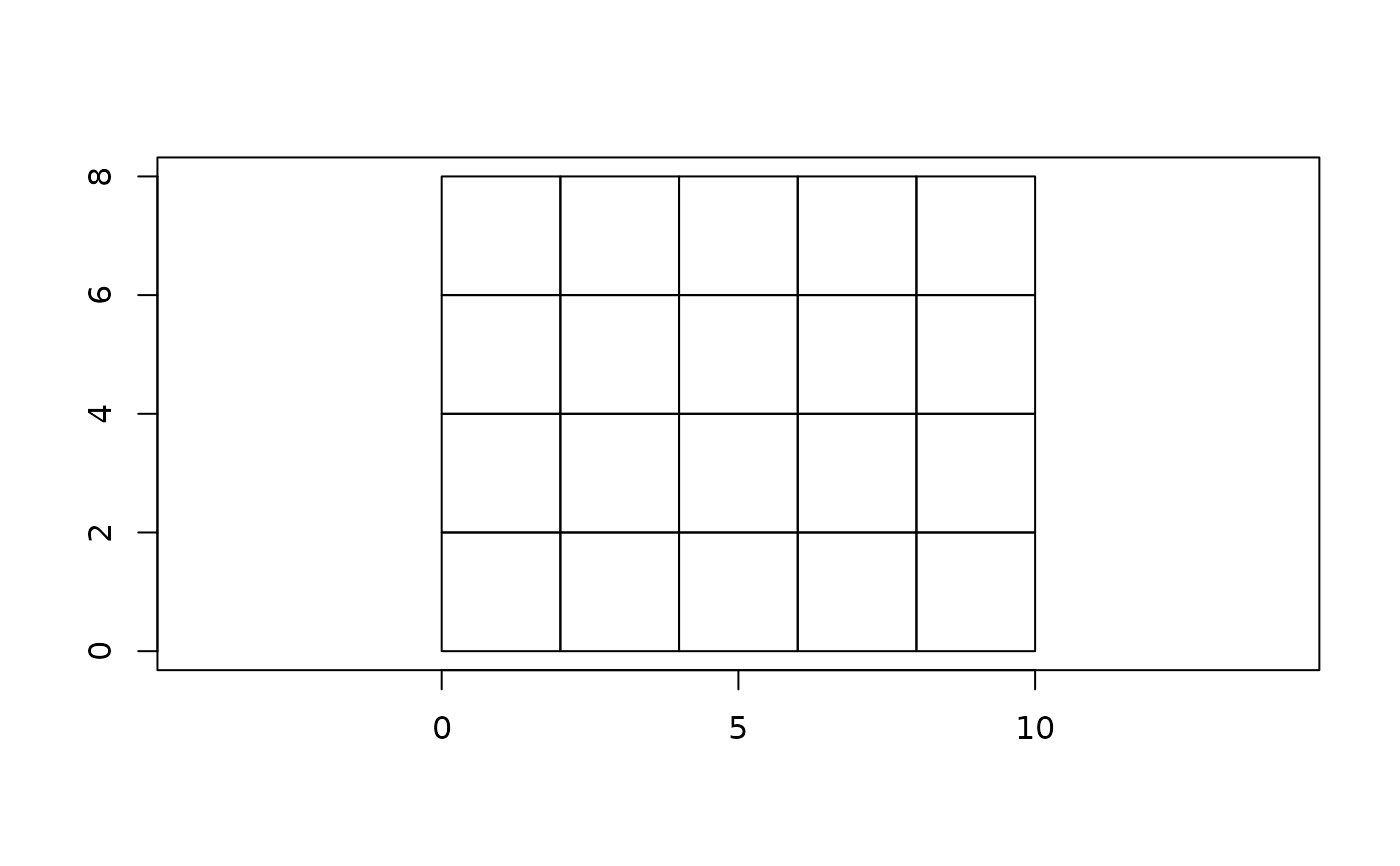
Draws the x-y geometry of a mesh in base graphics: quads (ib) and
triangles (it) as polygons, segments (is) as lines, and bare
vertices as points when no primitives are present.
Usage
# S3 method for class 'mesh3d'
plot(
  x,
  ...,
  asp = 1,
  add = FALSE,
  axes = TRUE,
  border = "black",
  col = NA,
  alpha = 1,
  lwd = 1,
  lty = 1
)
Arguments
- x
mesh3d object (with any or all of quads, triangles, segments)
- ...
ignored
- asp
aspect ratio, default 1
- add
add to an existing plot, default
FALSE- axes
draw axes (when starting a new plot), default
TRUE- border
border colour for polygons, default 'black'
- col
fill colour for polygons (line colour for segments), default
NA- alpha
transparency in
[0, 1], default 1 (opaque)- lwd
line width
- lty
line type