Computes an indicatrix_list containing per-point distortion objects
suitable for plotting with plot.indicatrix_list() or querying directly.
Usage
indicatrix(x, target = NULL, ..., source = "EPSG:4326")
Arguments
- x
a tissot_tbl, or any xy-ish input (see tissot())
- target
target projection CRS (extracted from tissot_tbl
attributes if x is one; required otherwise)
- ...
passed to tissot()
- source
source CRS (default "EPSG:4326")
Value
An indicatrix_list object (a list of indicatrix objects with
source and target stored as attributes)
Details
indicatrix() accepts either:
A tissot_tbl object (from tissot()) — projection is extracted
from attributes, target is optional
Any xy-ish input with an explicit target
Examples
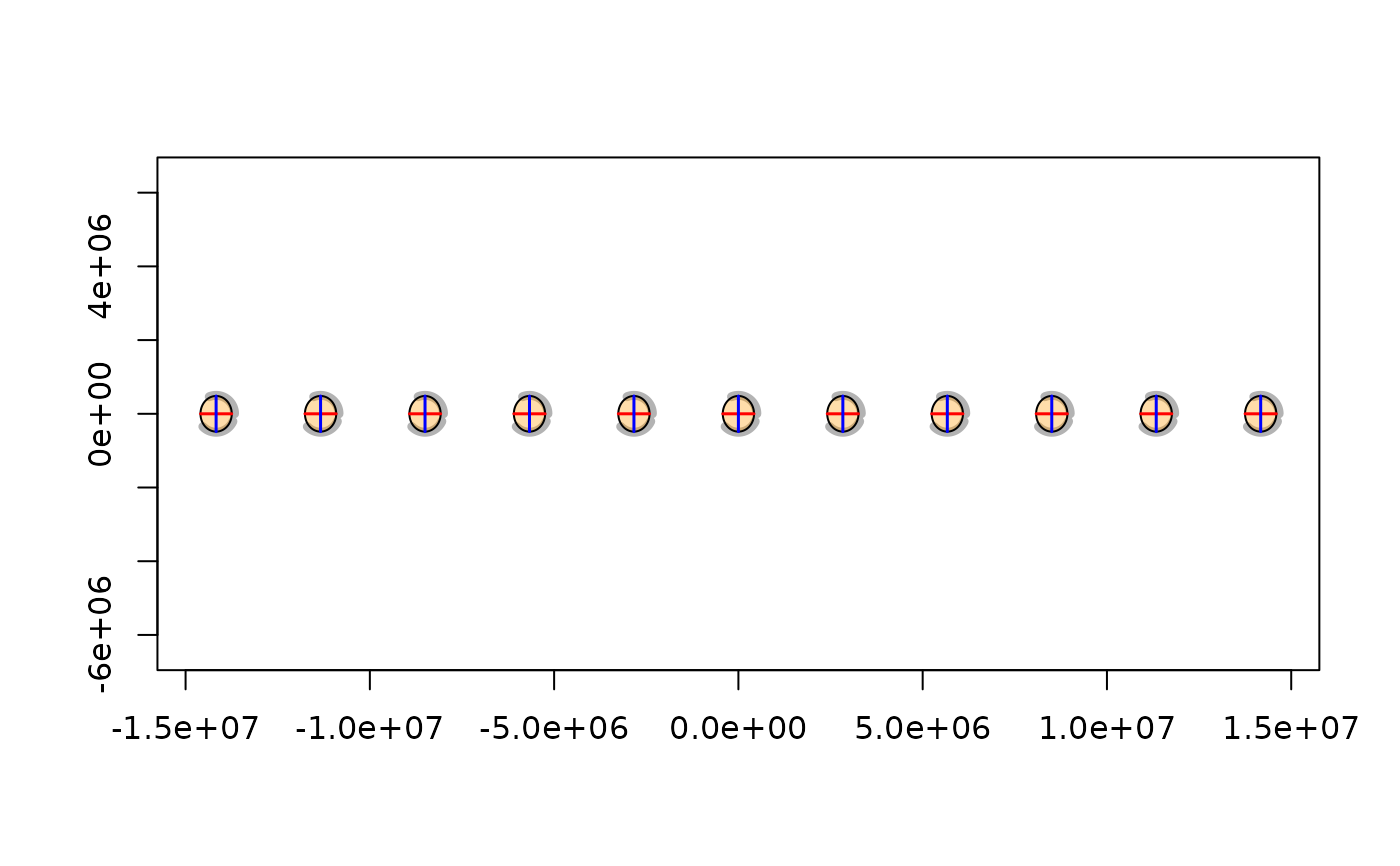
## From a tissot_tbl
r <- tissot(cbind(seq(-150, 150, by = 30), 0), "+proj=robin")
ii <- indicatrix(r)
plot(ii, scale = 5e5)
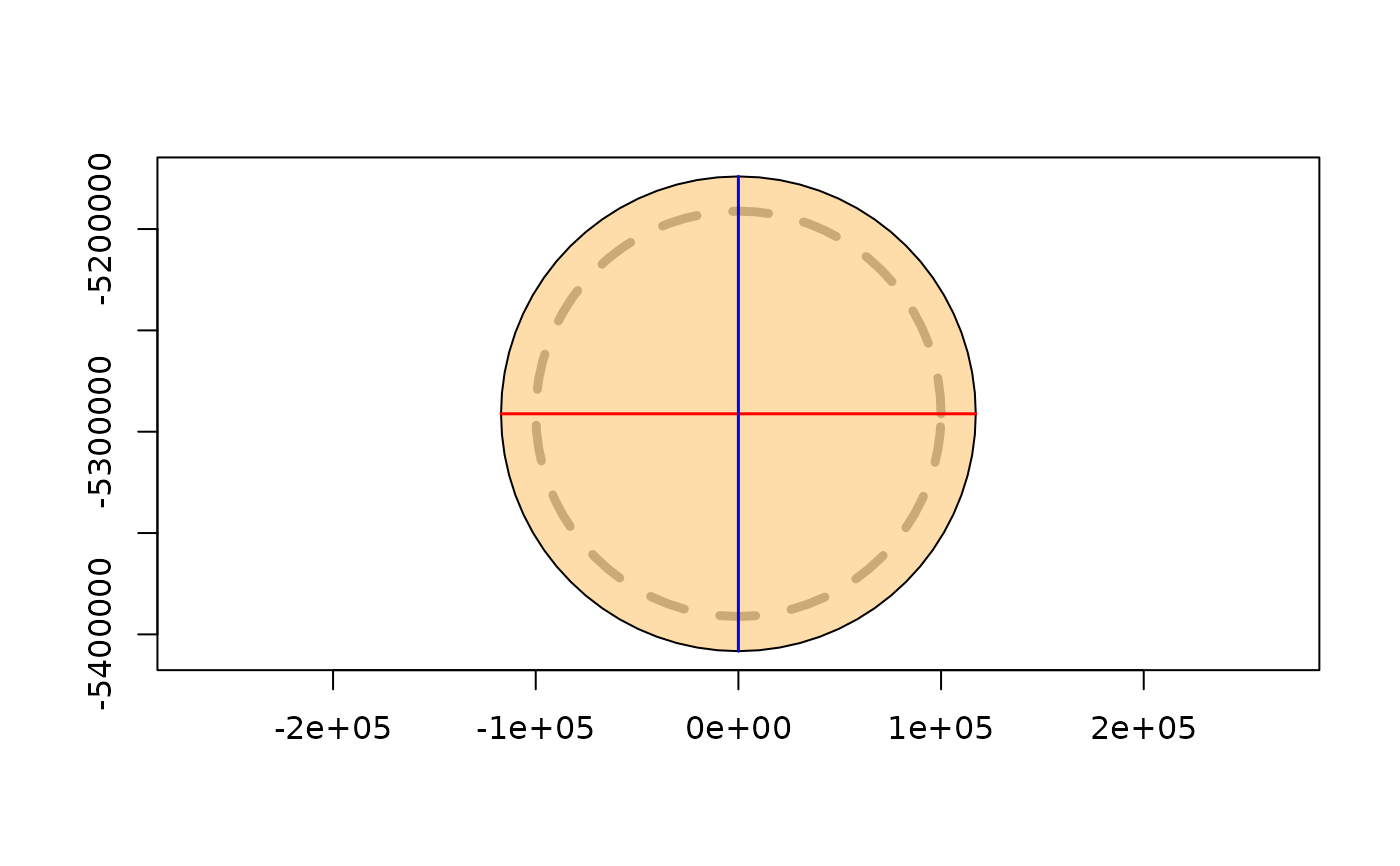
 ## From raw coordinates
ii2 <- indicatrix(c(0, 45), "+proj=stere +lat_0=90")
plot(ii2)
## From raw coordinates
ii2 <- indicatrix(c(0, 45), "+proj=stere +lat_0=90")
plot(ii2)