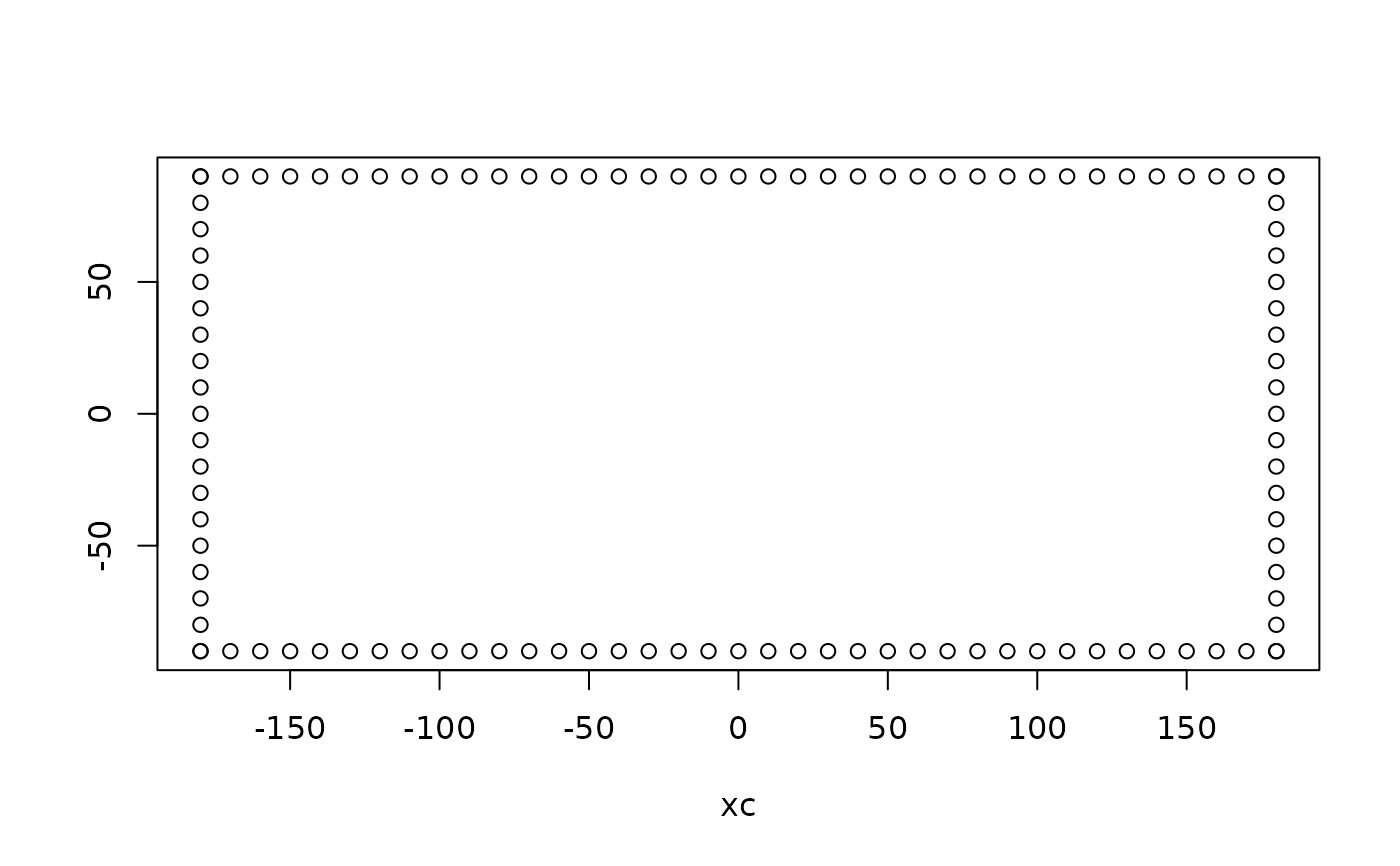
Generates the coordinates around a grid boundary, with a coordinate for each grid cell corner.
vaster_boundary(dimension, extent = NULL)Value
matrix of xy coordinates
Details
The orientation is starts along the bottom and goes counter-clockwise.
Generates the coordinates around a grid boundary, with a coordinate for each grid cell corner.
vaster_boundary(dimension, extent = NULL)matrix of xy coordinates
The orientation is starts along the bottom and goes counter-clockwise.