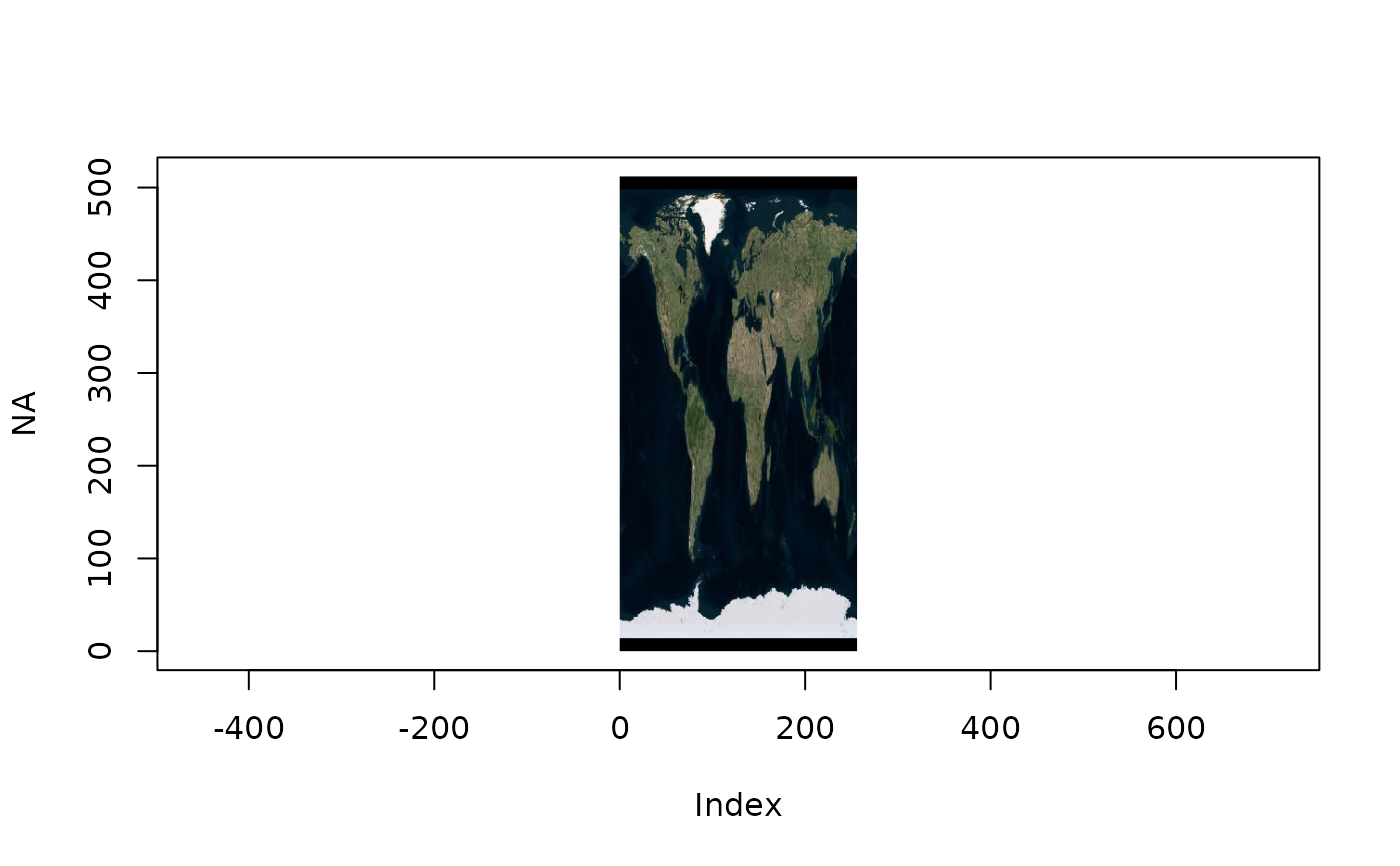
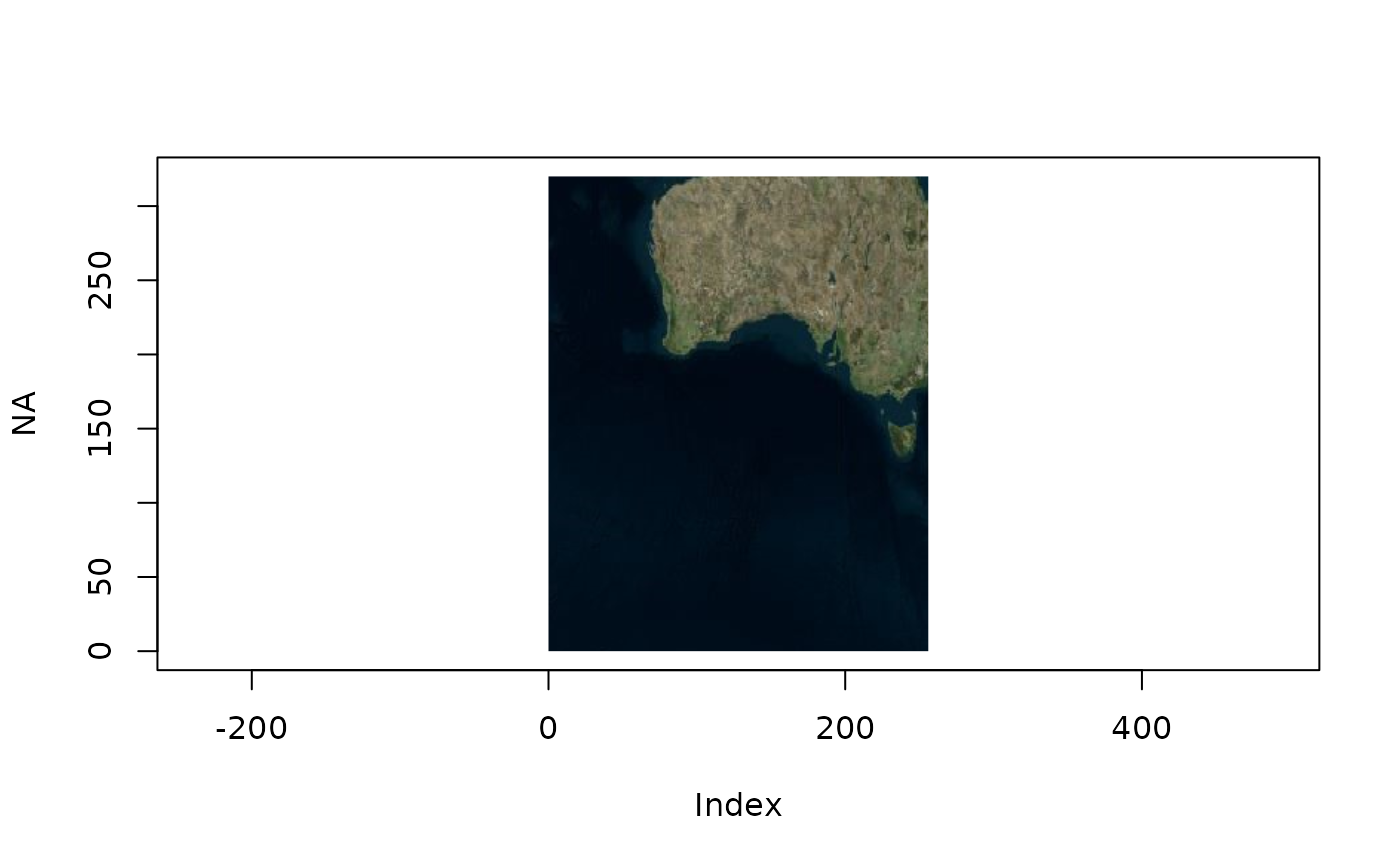
Read imagery data for any region on Earth.
imagery(
  extent = c(-180, 180, -90, 90),
  ...,
  dimension = NULL,
  projection = "OGC:CRS84",
  resample = "near",
  source = NULL
)

streetmap(
  extent = c(-180, 180, -90, 90),
  ...,
  dimension = NULL,
  projection = "OGC:CRS84",
  resample = "cubic",
  source = NULL
)

satbox(
  extent = c(-180, 180, -90, 90),
  ...,
  dimension = NULL,
  projection = "OGC:CRS84",
  resample = "near",
  source = NULL
)
Arguments
- extent
a numeric vector of xmin,xmax,ymin,ymax or a terra or raster rast object
- ...
arguments passed to 'vapour::vapour_warp_raster'
- dimension
optional output size in ncol,nrow (x,y)
- projection
optional coordinate reference system to use (map projection), longlat is assumed
- resample
resampling algorithm for the GDAL warper, "near" by default
- source
a GDAL raster source, to override the inbuilt source/s
Value
a matrix, or depending on format of 'extent' a terra rast or raster object with elevation data
Details
Note that data is streamed into memory, so don't make the dimensions of the 'x' target raster too big.
By default we're expecting 3 bands of bytes, but if only one is available that is used instead.
To use these data, please attribute the image provider, or otherwise use your own sources.
`imagery()` defaults to Virtual Earth, `streetmap()` to OSM, and `satbox()` to Mapbox Satellite.
To use `satbox()` you must set an environment variable such as 'MAPBOX_API_KEY' to your Mabox token.