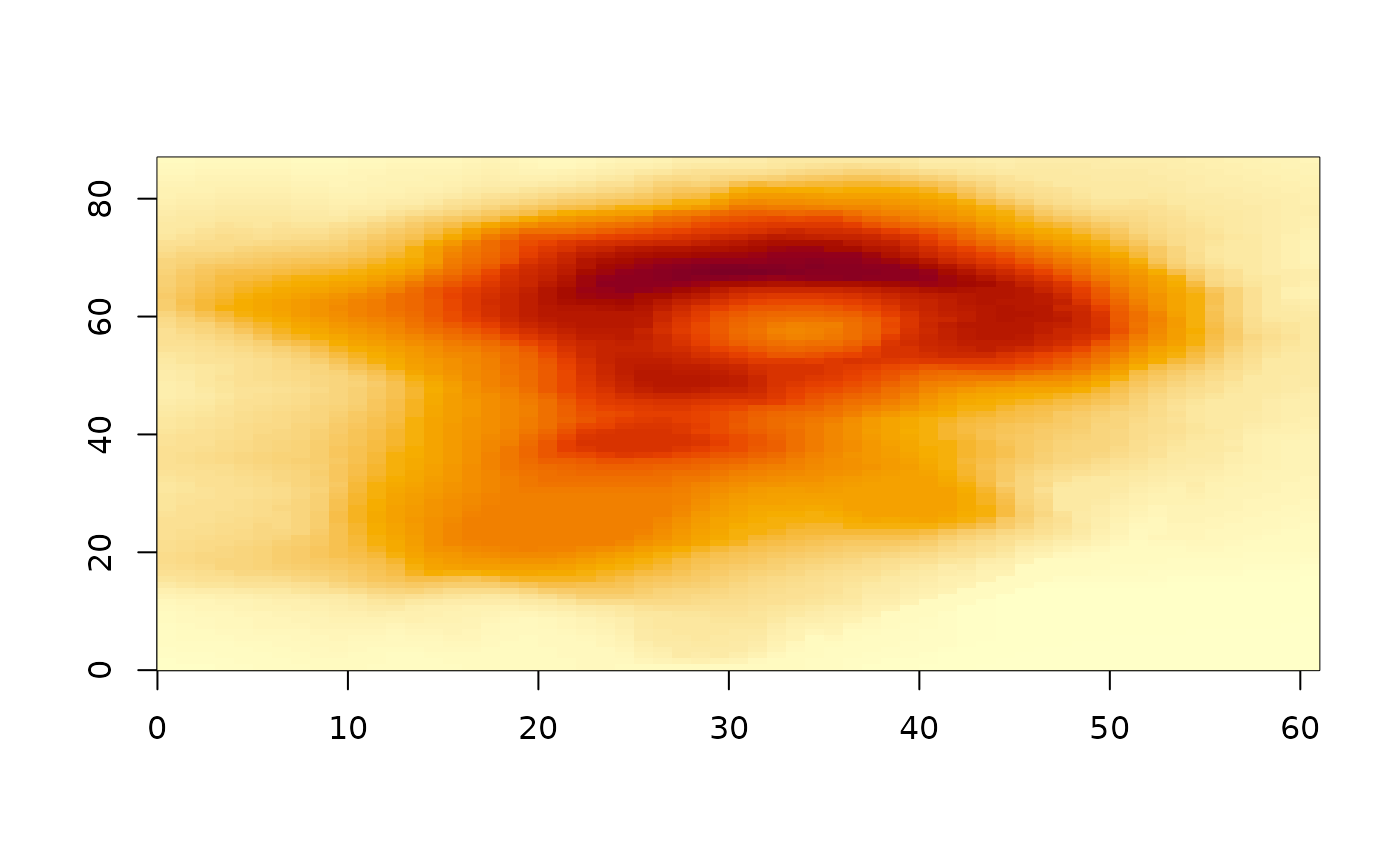
ximage combines the best of graphics::image() and graphics::rasterImage().
Usage
ximage(
  x,
  extent = NULL,
  zlim = NULL,
  add = FALSE,
  ...,
  xlab = NULL,
  ylab = NULL,
  col = hcl.colors(96, "YlOrRd", rev = TRUE),
  breaks = NULL,
  alpha = NULL,
  na.col = "transparent"
)
Arguments
- x
matrix, array, raw or character matrix, native raster (nativeRaster, or raster), or list as output by GDAL reader functions
- extent
optional, numeric xmin,xmax,ymin,ymax
- zlim
optional, absolute range of data to map colours to (maintains comparable colours across plots); values outside display as 'na.col'; single-band numeric data only
- add
add to plot, or start afresh
- ...
passed to plot when
add = FALSE- xlab
x axis label, empty by default
- ylab
y axis label, empty by default
- col
colours to map single-band data to
- breaks
a set of finite numeric breakpoints for the colours, one more break than colour (if not, colours are interpolated to fit)
- alpha
optional constant opacity in
[0, 1](or vector/matrix, recycled) applied on top of any existing alpha channel; not supported for nativeRaster input- na.col
colour for missing values, default "transparent"
Value
invisibly, a list with 'x' (the colour data as plotted) and 'extent' (xmin, xmax, ymin, ymax used, the 0,ncol 0,nrow index space of the input if not supplied)
Details
ximage() is a combination those graphics function with the the best features in one.
Allow arrays with RGB/A.
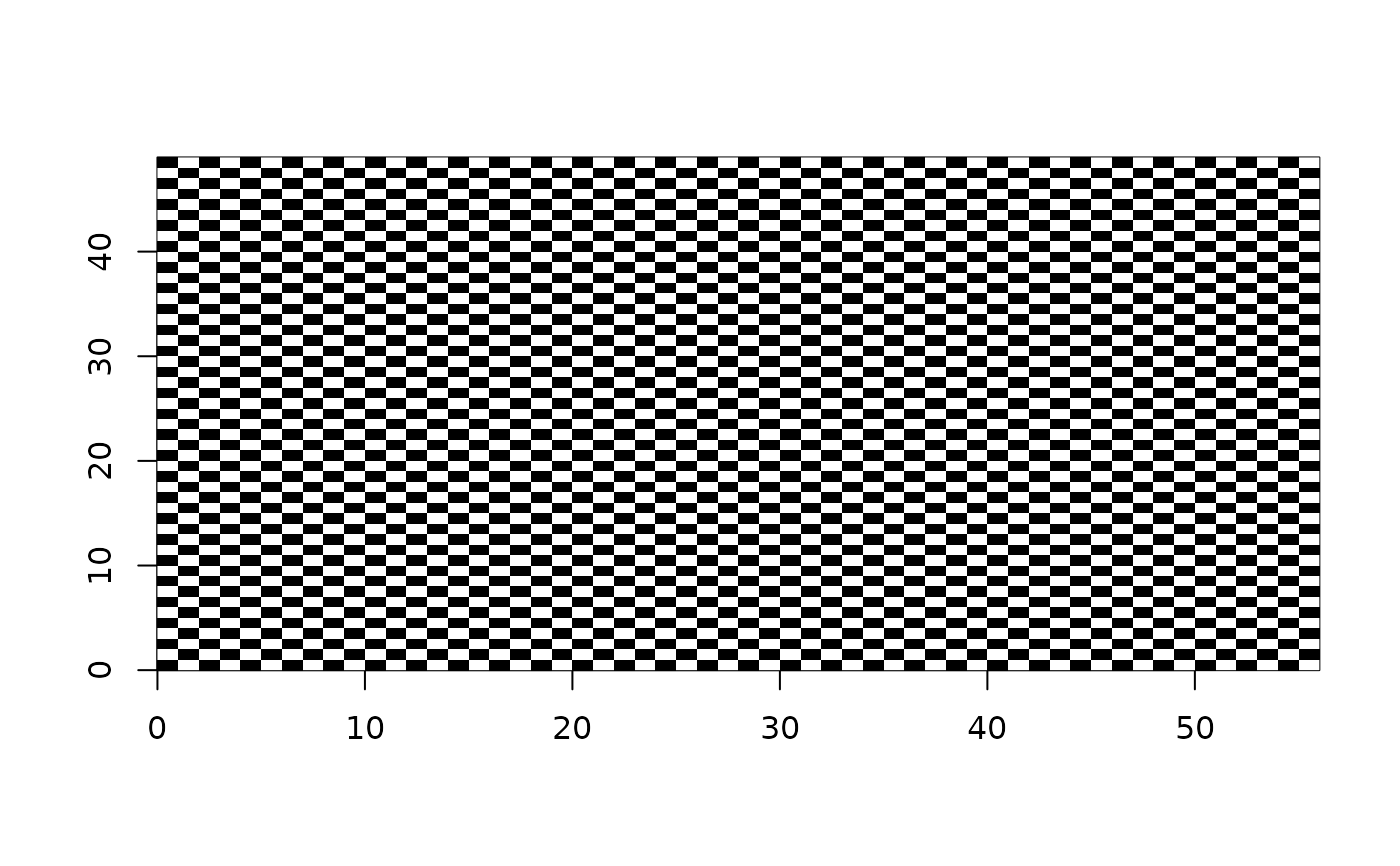
Allow matrix with character (named colours, or hex) or raw (Byte) values
Allow list output from vapour or gdalraster, a list with numeric values, hex character, or nativeRaster
Plot in 0,ncol 0,nrow by default
Override default with extent (xmin, xmax, ymin, ymax)
Allow general numeric values.
Start a plot from scratch without setting up a plot to paint to.
Plot by default in 0,ncol,0,nrow if unspecified.
Data orientation is "raster order", the first cell is the top-left of the displayed image, following scan lines down the page (see the package vignette on orientation).
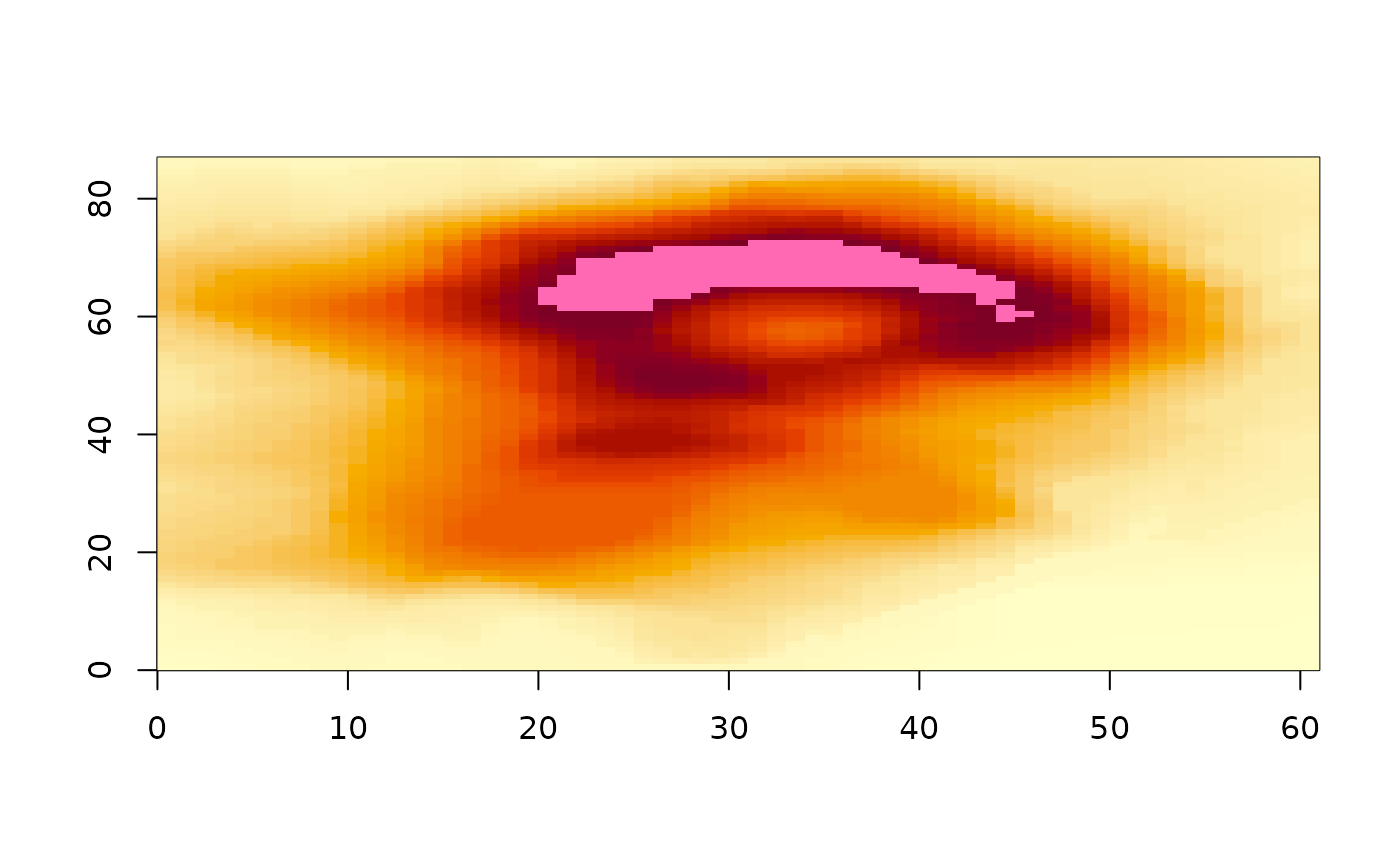
Colour mapping via 'col', 'breaks', and 'zlim' applies to single-band numeric data only. Multi-band (grey/alpha, RGB, RGBA) data is scaled automatically: values within 0,1 are used as-is, within 0,255 are divided by 255, and anything else is rescaled by the finite range of the colour bands. Missing values (NA, NaN) display as 'na.col' in all cases.