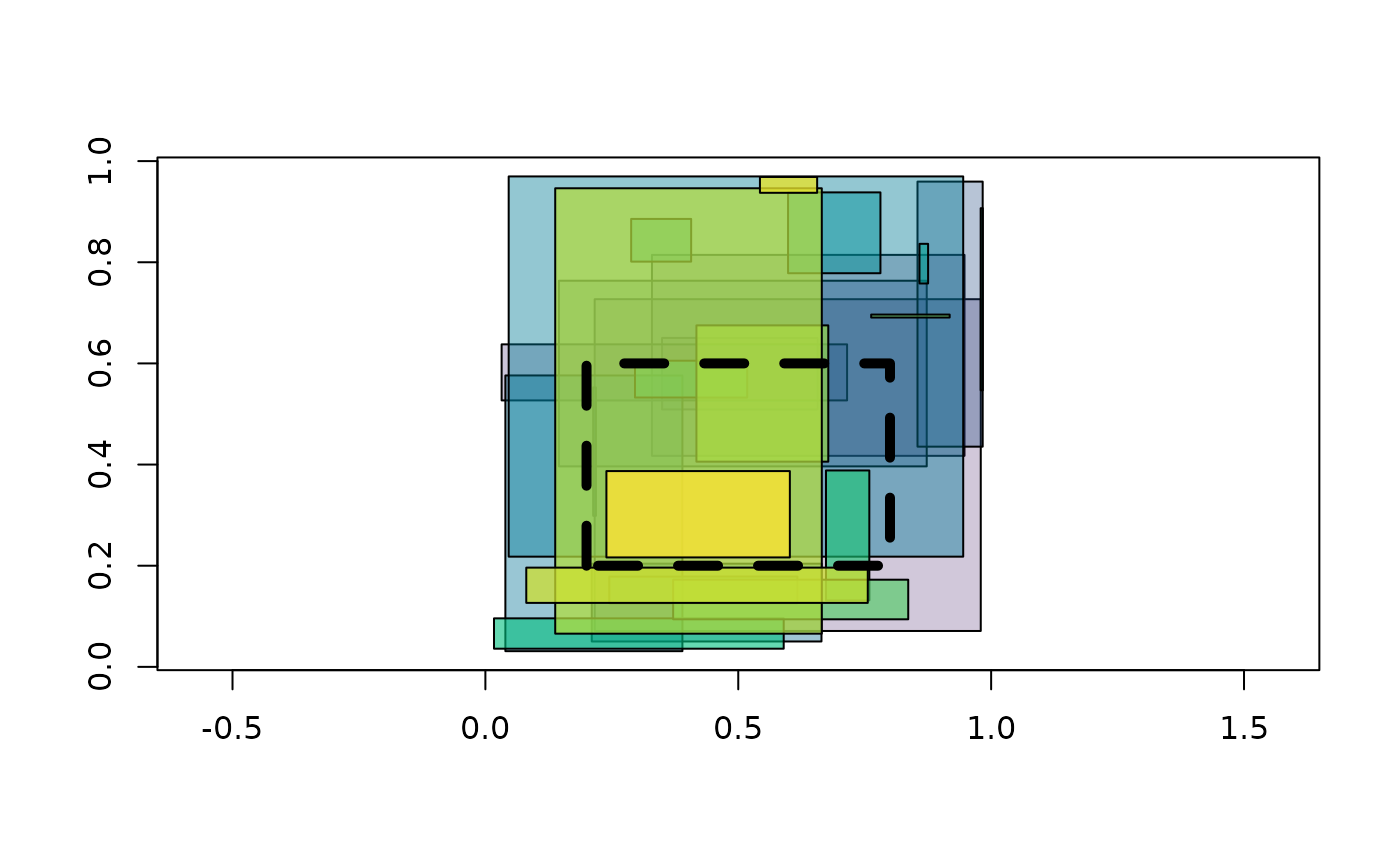
Draw rectangles from four colummns xmin,xmax,ymin,ymax
Usage
xrect(x, add = FALSE, ..., asp = 1L)
Arguments
- x
four columns worth of rectangles
- add
instantiate a plot or add to existing (default is add = FALSE)
- ...
arguments passed to rect()
- asp
aspect ratio, defaults to 1
Value
nothing, called for side effect of creating or adding to a plot
Details
Calls rect(), but will instantiate a plot if add = FALSE.
Examples
xrect(runif(100))
 xrect(sort(runif(100)))
 xrect(runif(100), col = hcl.colors(25, alpha = seq(.2, .8, length.out = 25)))
ex <- c(0.2, 0.8, .2, .6)
xrect(ex, add = TRUE, lwd = 5, lty = 2)
xrect(runif(100), col = hcl.colors(25, alpha = seq(.2, .8, length.out = 25)))
ex <- c(0.2, 0.8, .2, .6)
xrect(ex, add = TRUE, lwd = 5, lty = 2)