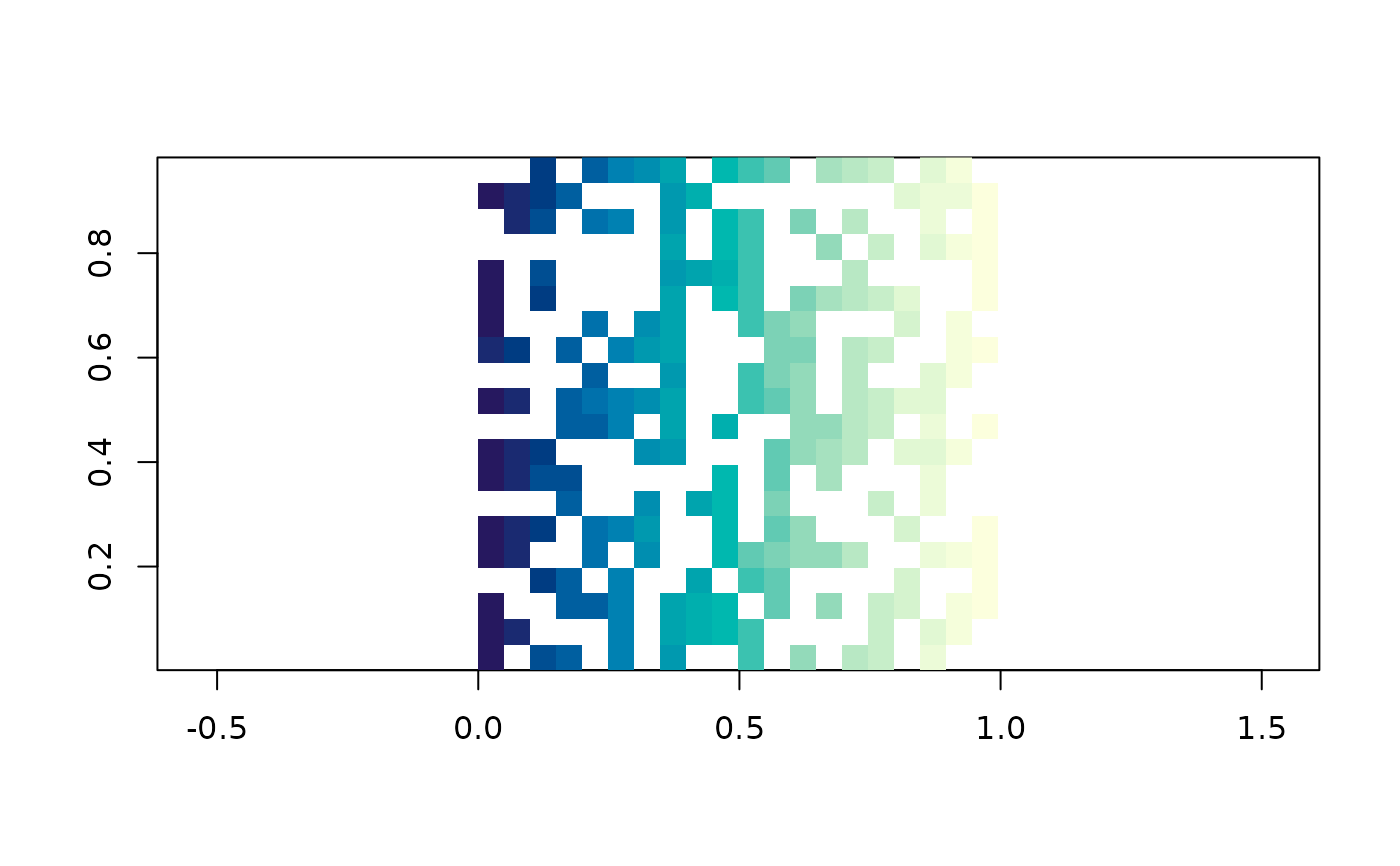
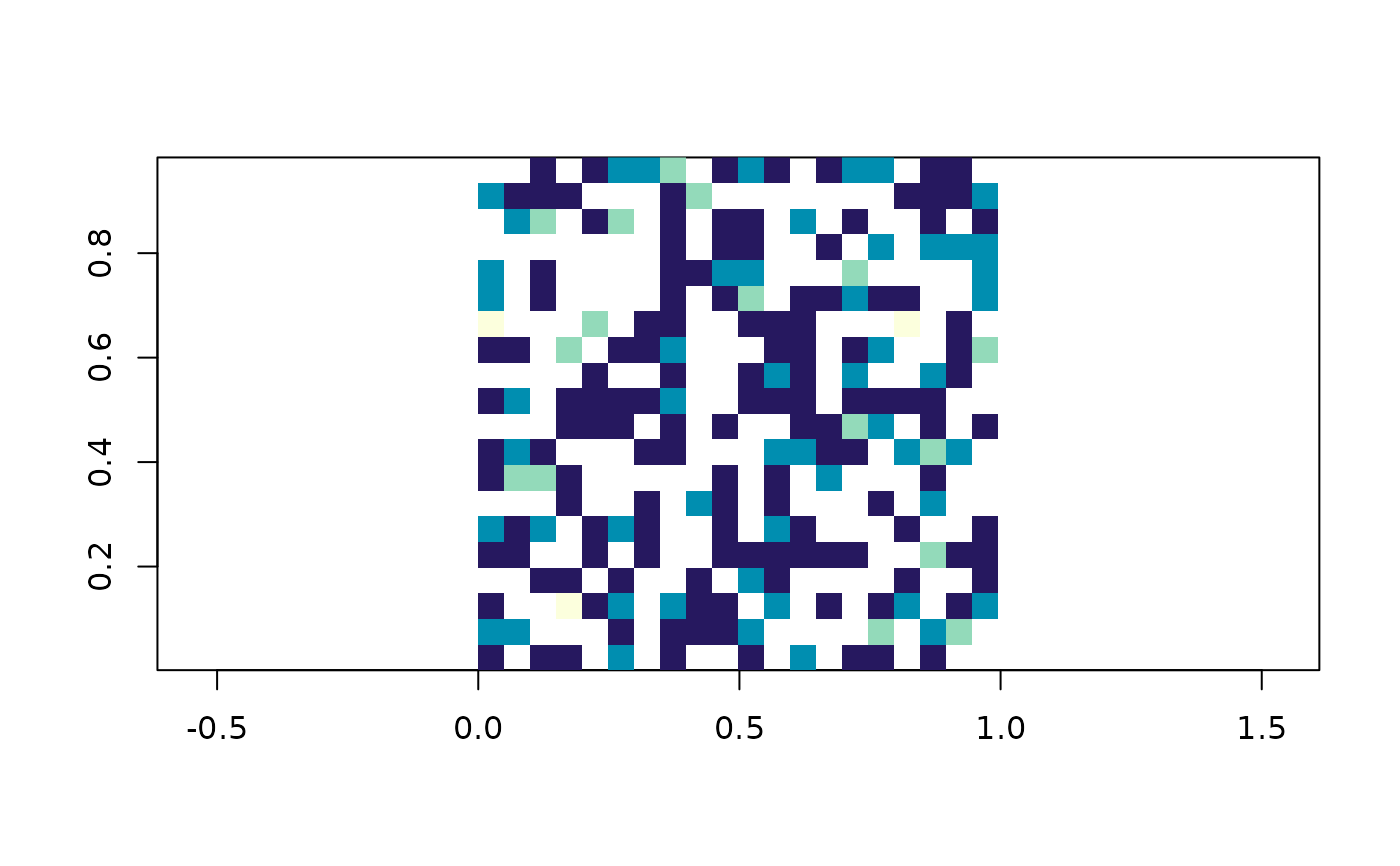
Assign each point to the cell that contains it, and combine the values that land in the same cell.
Arguments
- x
coordinates, or coordinates carrying their value as z; see
xyz_input()- value
one value per coordinate, or
NULLto use the z ofx- grid
a
grid_spec()to interpolate onto, orNULLfor a default one- fun
function used to combine the values in one cell
- ...
ignored
Details
This is the simplest thing that can be called interpolation, and it is not
really interpolation at all: nothing is estimated between the points, cells
with no point in them stay NA, and the answer depends entirely on how big
the cells are. It is here because it is the honest baseline, and because the
question it raises – what should happen when two points land in one cell –
is a question every other method answers silently.
fun is that answer, made explicit. mean averages them, length counts
them, function(x) x[1] keeps the first, and looking at grid_bin(fun = length) next to any other method is the quickest way to see where a surface
is supported by data and where it is supported by the algorithm.
Points on the outer edge of the extent are outside the last cell and are
dropped, which is one reason to pad a grid; see grid_spec().
The whole implementation is vaster::cell_from_xy() and tapply(). No
raster class is involved, because none is needed.