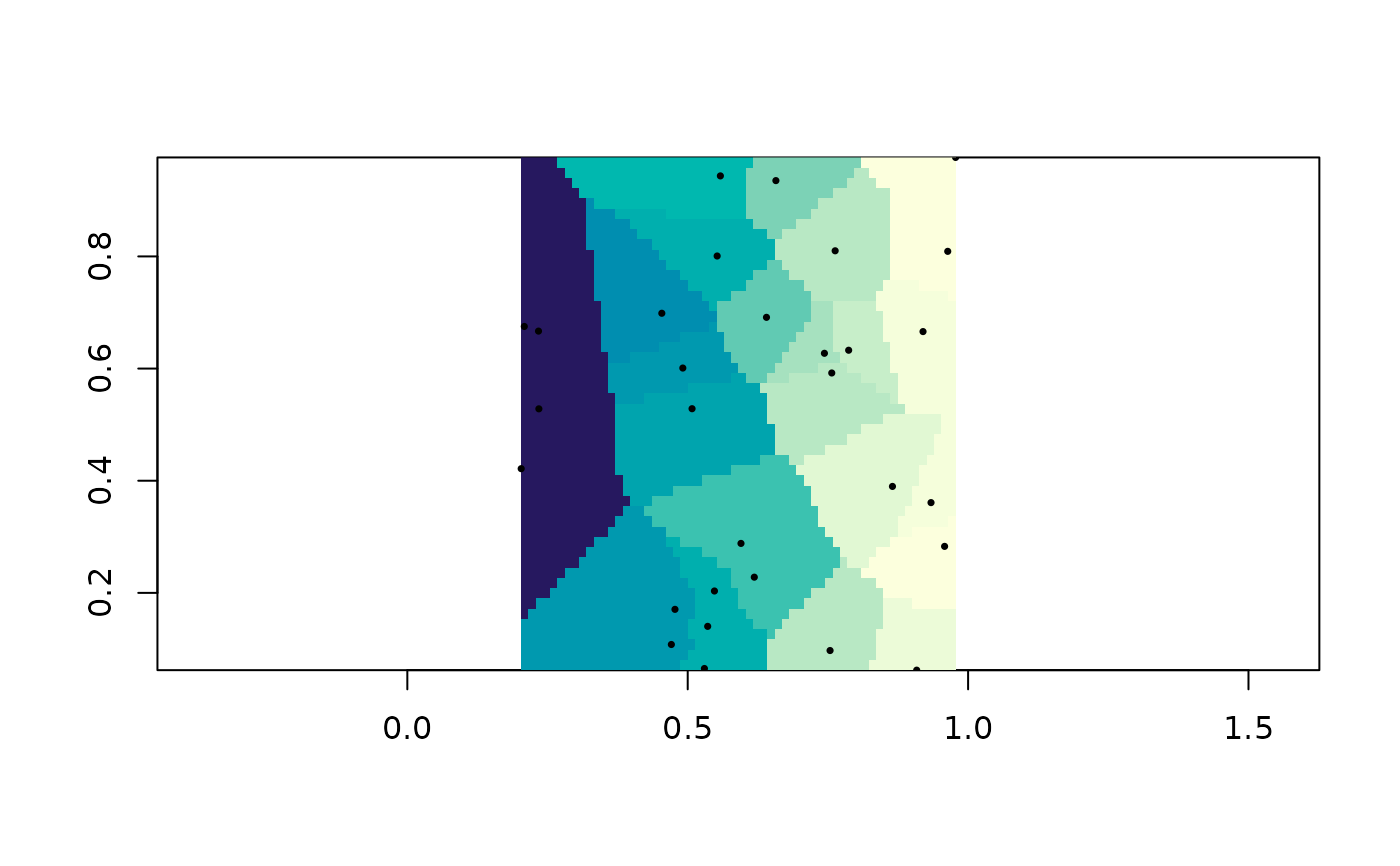
Give every cell the value of the closest input point.
Arguments
- x
coordinates, or coordinates carrying their value as z; see
xyz_input()- value
one value per coordinate, or
NULLto use the z ofx- grid
a
grid_spec()to interpolate onto, orNULLfor a default one- duplicates
function used to combine values at repeated coordinates, or
NULLto leave them alone- ...
ignored
Details
The tessellation is the picture of that rule. A Voronoi tile is exactly the region closer to its own point than to any other, so assigning each cell to the tile it falls in is nearest neighbour, drawn rather than computed.
Unlike grid_barycentric(), this fills the whole grid. Voronoi tiles cover
the plane, so there is no convex hull to fall outside of – which is
convenient and is also the method's main way of lying to you, since a cell
far beyond the data gets a confident answer from one distant point.