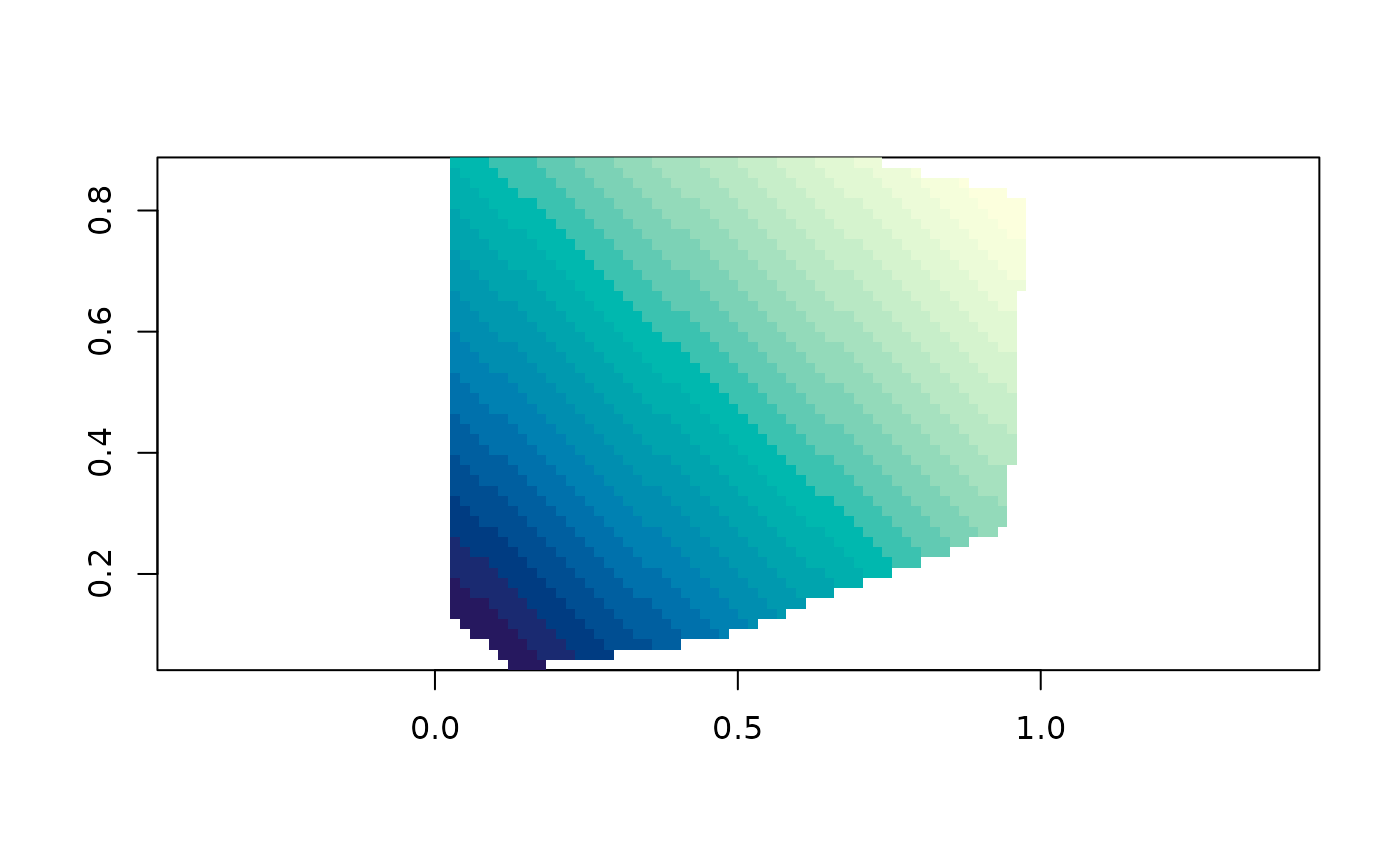
Draw the grid with graphics::image(). No raster class is involved, which
is the point: a grid is a dimension, an extent and a vector of values, and
that is enough to draw it.
Usage
# S3 method for class 'guerrilla_grid'
plot(x, col = grDevices::hcl.colors(24, "YlGnBu"), asp = 1, ...)
Arguments
- x
a
guerrilla_gridwith values- col
colours
- asp
aspect ratio;
1by default, or useNAto fill the device- ...
passed to
graphics::image()
Examples
xy <- cbind(runif(50), runif(50))
g <- grid_barycentric(xy, xy[, 1] + xy[, 2])
plot(g)