A line between two points on the Earth is a great circle arc. Draw it on a flat map by joining its two ends and you draw the wrong line. bigcurve adds the vertices a line needs to keep its true shape in a given map projection: more where the projection bends it, none where it doesn’t.
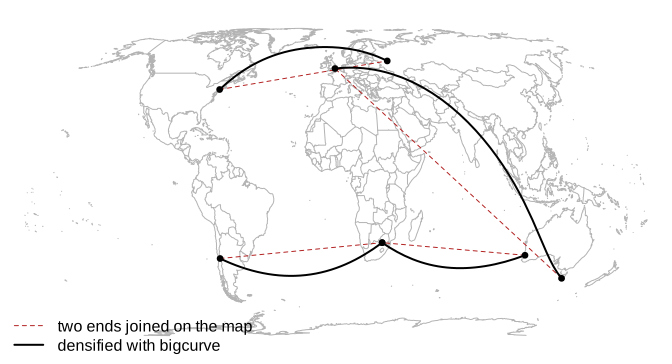
The method is the adaptive resampling Mike Bostock wrote for d3-geo, with projections from PROJ. The error is measured where it matters: in the plane of the map you are going to draw.
Installation
Once bigcurve is on CRAN:
install.packages("bigcurve")The development version is on r-universe:
install.packages("bigcurve",
                 repos = c("https://hypertidy.r-universe.dev", "https://cloud.r-project.org"))
Building from source needs the PROJ library, version 8 or later (libproj-dev on Debian and Ubuntu, proj-devel on Fedora, proj from Homebrew); Rtools on Windows has PROJ built in.
Quick start
densify() takes longitude, latitude coordinates and a target projection, and returns longitude, latitude coordinates with the new vertices in place. segment() makes a two point line to play with.
library(bigcurve)
hobart_london <- segment(c(147.3, -0.1), c(-42.9, 51.5))
hobart_london
#>          x     y
#> [1,] 147.3 -42.9
#> [2,]  -0.1  51.5

d <- densify(hobart_london, "+proj=eqearth")
nrow(d)
#> [1] 34
head(d)
#>          [,1]      [,2]
#> [1,] 147.3000 -42.90000
#> [2,] 141.9246 -40.12072
#> [3,] 136.9878 -37.11298
#> [4,] 132.4395 -33.91654
#> [5,] 128.2278 -30.56523
#> [6,] 113.8000 -16.11857
The output is still in longitude and latitude, so any tool can project it. rproj_xy() projects a coordinate matrix with PROJ:
Adaptive: the projection decides
The same line needs a different number of vertices in each projection, because it is a different curve on each map. Where a projection draws a great circle as a straight line it needs no new vertices at all: in a gnomonic projection every great circle is straight.
projections <- c(eqearth = "+proj=eqearth",
                 laea = "+proj=laea +lon_0=70 +lat_0=10",
                 gnom = "+proj=gnom +lon_0=100 +lat_0=0")
s <- segment(c(100, 160), c(-35, -35))
op <- par(mfrow = c(1, 3), mar = c(0.5, 0.5, 2, 0.5))
for (p in names(projections)) {
  d <- densify(s, projections[[p]])
  xy <- rproj_xy(d, projections[[p]])
  plot(xy, type = "l", asp = 1, axes = FALSE, xlab = "", ylab = "")
  points(xy, pch = 19, cex = 0.6)
  box(col = "grey80")
  title(sprintf("%s: %d vertices", p, nrow(d)), font.main = 1)
}
par(op)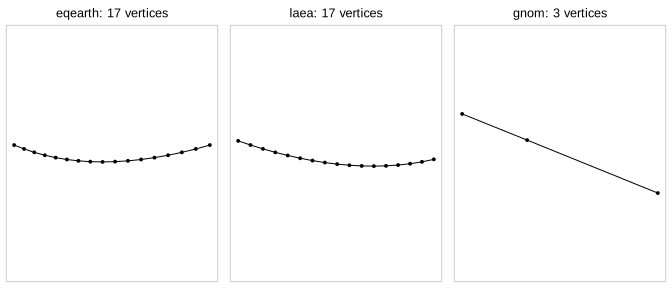
Tolerance
tolerance is how far, in the map’s own units (usually metres), the drawn chords may stray from the true curve. The default is one part in 2048 of the projected extent, about a pixel on a large plot; set it directly for anything else.
sapply(c(100000, 10000, 1000, 100), function(tol)
  nrow(densify(hobart_london, "+proj=eqearth", tolerance = tol)))
#> [1]  10  26  86 257
A tenfold tighter tolerance costs about three times the vertices (the square root of ten), because the error of a chord falls with the square of its length.
Inputs
densify() accepts
- a two column matrix (one path),
- a list of matrices (several paths),
- a segment mesh in the rgl
mesh3dstyle (vbvertices,issegment index pairs), - a wkpool vertex pool, and so any geometry that wk can read (sf, geos, s2, WKB, WKT) after
wkpool::establish_topology().
A pool comes back as a pool, keeping its crs, its feature and path provenance, and its existing vertex ids, with new ids for the added vertices.
Graticules and shared boundaries
A grid of cells is a good test, with one catch worth knowing first. Each cell edge runs between two corners, so bigcurve (like s2) reads it as a great circle arc. The north and south sides of a cell are therefore not parallels of latitude: a parallel is a small circle, and the great circle between two corners on it cuts inside it, towards the pole. The meridian sides are great circles, and they bend on any map that is not centred on the pole. An edge shared by two neighbouring cells gets exactly the same new vertices from both sides, so the cells still fit together after densifying.
lon <- seq(-180, 150, by = 30)
lat <- seq(-75, -45, by = 15)
cells <- expand.grid(x = lon, y = lat)
wkt <- sprintf("POLYGON ((%s %s, %s %s, %s %s, %s %s, %s %s))",
               cells$x, cells$y, cells$x + 30, cells$y, cells$x + 30, cells$y + 15,
               cells$x, cells$y + 15, cells$x, cells$y)
pool <- wkpool::establish_topology(wk::wkt(wkt, crs = "OGC:CRS84"))

prj <- "+proj=laea +lon_0=0 +lat_0=-40"
out <- densify(pool, prj)
c(input = nrow(wkpool::pool_vertices(pool)),
  densified = nrow(wkpool::pool_vertices(out)))
#>     input densified
#>       180       524
Each cell was densified on its own, yet merging coincident vertices afterwards gives exactly the vertices you get by merging first and densifying the shared edges once. The twins agree to the last bit:
merged_after <- wkpool::pool_vertices(wkpool::merge_coincident(out))
merged_first <- wkpool::pool_vertices(densify(wkpool::merge_coincident(pool), prj))
nrow(merged_after)
#> [1] 254
identical(sort(complex(real = merged_after$x, imaginary = merged_after$y)),
          sort(complex(real = merged_first$x, imaginary = merged_first$y)))
#> [1] TRUE
To draw it, turn the pool back into geometry and project with wk and PROJ, the fast general path for wk geometry. The grey dashed lines are the true parallels, for comparison:
geom <- wkpool::cycles_to_wkb(wkpool::merge_coincident(out))
drawn <- wk::wk_transform(geom, PROJ::proj_trans_create(wk::wk_crs(geom), prj))
xy <- wk::wk_coords(drawn)
op <- par(mar = rep(0.5, 4))
plot(range(xy$x), range(xy$y), type = "n", asp = 1, axes = FALSE, xlab = "", ylab = "")
plot(drawn, add = TRUE, col = "grey95")
for (y in seq(-75, -30, by = 15)) {
  lines(rproj_xy(cbind(seq(-180, 180, by = 1), y), prj), col = "grey50", lty = 2)
}
points(xy$x, xy$y, pch = 19, cex = 0.3)
par(op)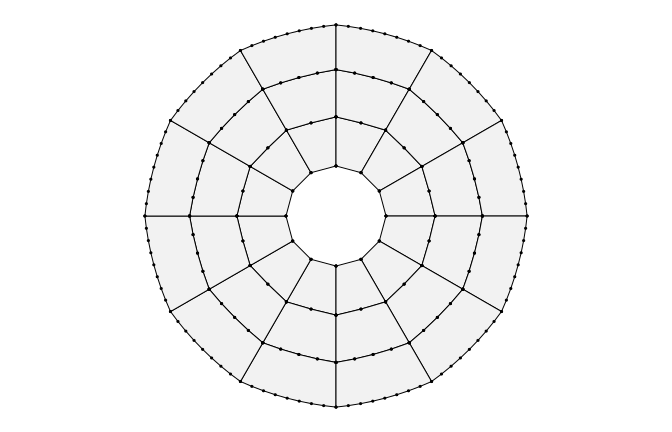
The meridian sides curve with the map, and bigcurve follows them. The other sides sit just inside the parallels, as great circles should. If what you want is a true graticule, with sides that follow the parallels, the edges are not great circles at all: put the vertices along the parallels in longitude and latitude first (every degree, say), and densify() then has nothing left to do on those sides.
The edges of the map
- Points that can’t be projected never error. A segment with an end beyond the horizon of an orthographic map, say, is left as it is. Clipping is a job for another package.
-
The antimeridian. bigcurve keeps whatever longitudes you give it. An edge written from 170 to -170 refines continuously through 180, and an edge along 180 stays at 180. To join the two sides of the seam into one boundary, densify first and then use
wkpool::merge_coincident(period_x = 360). -
A sphere, not an ellipsoid. New vertices are great circle midpoints on a sphere, as in s2 and d3-geo. For drawing a map the difference is small; for geodesics on the ellipsoid use the geographiclib package, or pass
ellipsoid = TRUEtodensify()(which uses it) to put the new vertices on the WGS84 geodesic. On a 17,000 km route such as Hobart to London the geodesic runs up to about 23 km to one side of the great circle.
bigcurve and s2
s2 and bigcurve agree that an edge between two longitude, latitude points is a great circle arc. s2 works out what a shape is on the sphere (intersections, areas, distances); bigcurve draws that shape in any map projection with just enough vertices. The vignette walks through the difference and shows them working together: vignette("bigcurve-and-s2", package = "bigcurve").
How it works
For each segment, bigcurve projects the great circle midpoint and measures how far it lands from the straight chord between the projected ends. If that is more than tolerance, or the midpoint lands well off the middle of the chord, the segment is split in two and each half is checked the same way, down to max_depth levels. Arcs longer than 30 degrees always split, since a long arc can curve away and back and fool the midpoint test.
The engine is a small header-only C++ file (src/bigcurve.h) with no R or PROJ in it; the transform is plugged in from outside. It follows d3-geo’s resampleLineTo, and carries d3-geo’s ISC notice in inst/COPYRIGHTS. Mike Bostock’s write-up of the idea is at https://bost.ocks.org/mike/example/.
The Rust crate bigcurve (hypertidy/bigcurve-rs) is the canonical engine. It reproduces this header bit for bit on the package’s own cases, and adds edge models (straight lines in a projected source, alongside great circles) and a batched forward map. The header is frozen: it gets bug fixes, but new engine features land in the crate first, and canon/ checks the header against the crate’s canon tables (plan).
Code of Conduct
Please note that the bigcurve project is released with a Contributor Code of Conduct. By contributing to this project, you agree to abide by its terms.