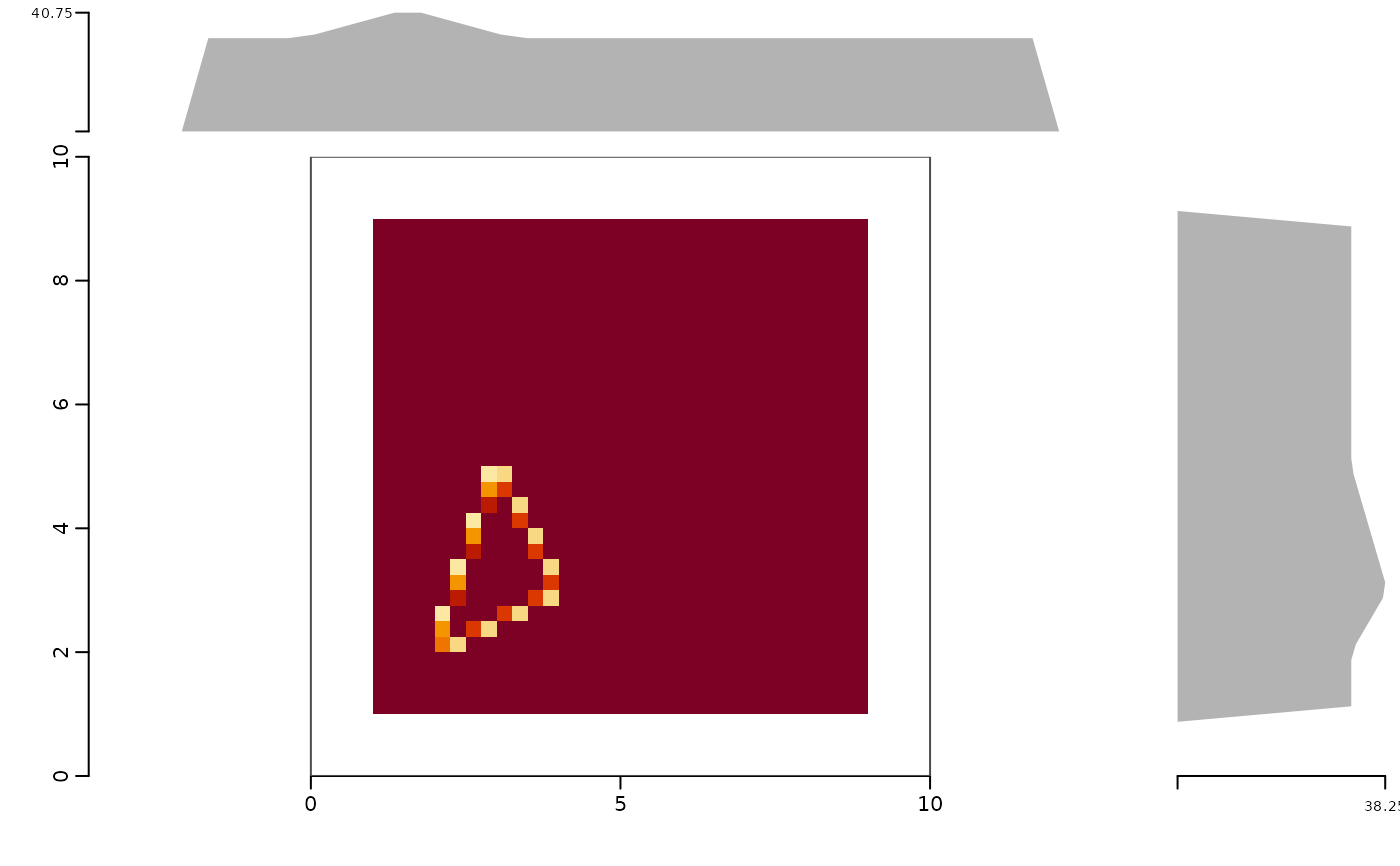
Draw a burn() result in map coordinates (asp = 1) with the grid
extent as the frame. Two renderings are available:
Usage
# S3 method for class 'controlledburn'
plot(
  x,
  what = c("auto", "exact", "overview"),
  marginals = TRUE,
  col = grDevices::hcl.colors(64, "YlOrRd", rev = TRUE),
  by_id = FALSE,
  tiles = 256L,
  threshold = 50000,
  content = FALSE,
  main = NULL,
  ...
)
Arguments
- x
A
controlledburnobject returned byburn().- what
"auto","exact", or"overview".- marginals
Draw the row and column marginal strips. The layout is sized from the extent's aspect ratio so the strips span exactly the map; leftover device space is left blank.
- col
Colour ramp (low to high coverage) for
"overview"and for edge shading in"exact".- by_id
In
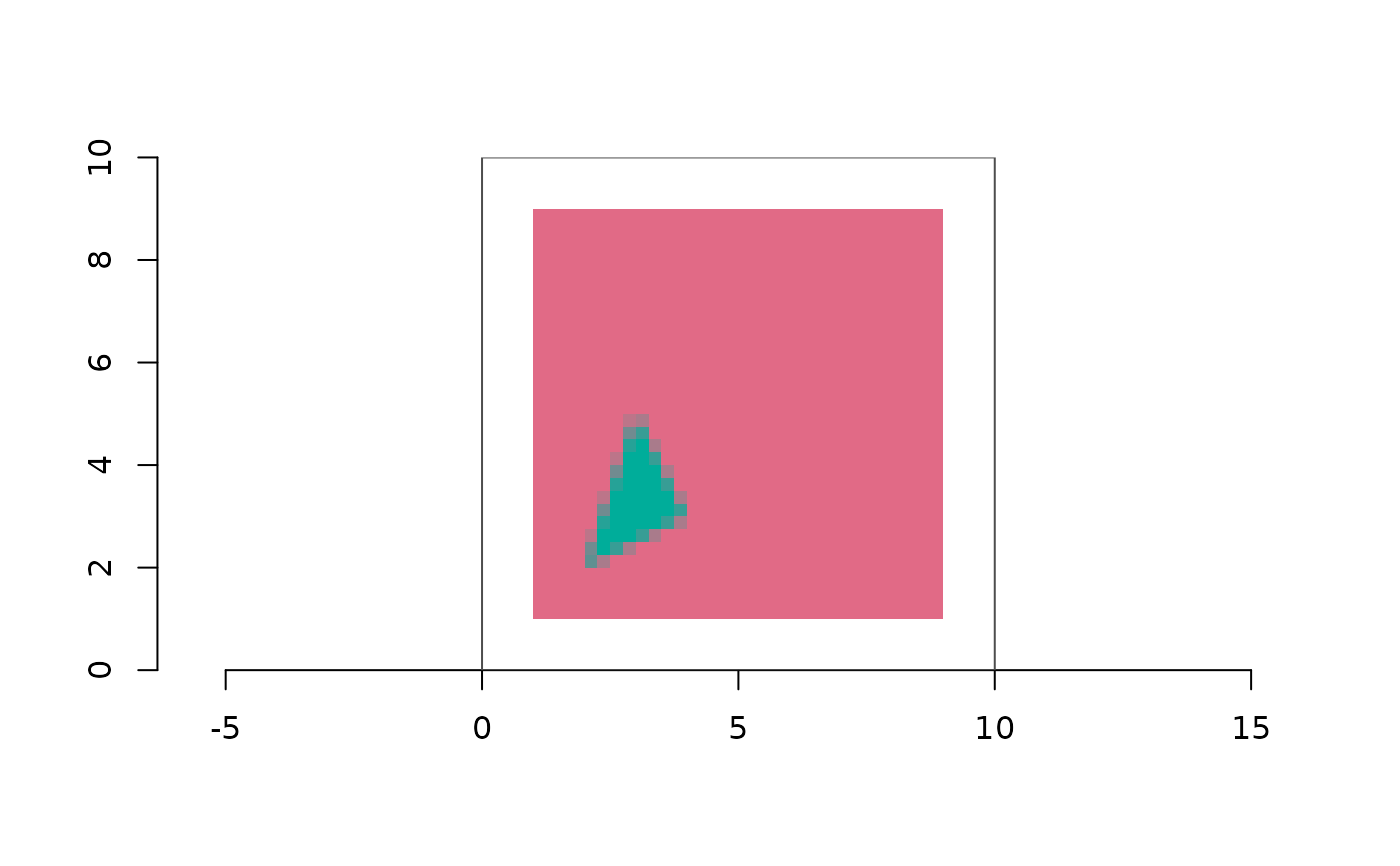
"exact"mode, colour cells by geometryidinstead of by coverage (edge cells take their fraction as opacity).- tiles
Passed to
overview_burn()for the"overview"rendering.- threshold
Record count above which
"auto"switches to"overview".- content
Draw the content extent (bounding box of touched cells) as a dashed rectangle.
- main
Optional title, drawn in the outer margin above the strips.
- ...
Passed to
graphics::plot()for the main panel.
Details
"exact"every record is drawn: runs as rectangles, edge cells shaded by coverage fraction, line cells shaded by length (relative to the cell diagonal), points as cells. Cost is one rectangle per record, so this is the picture of the sparse representation itself.
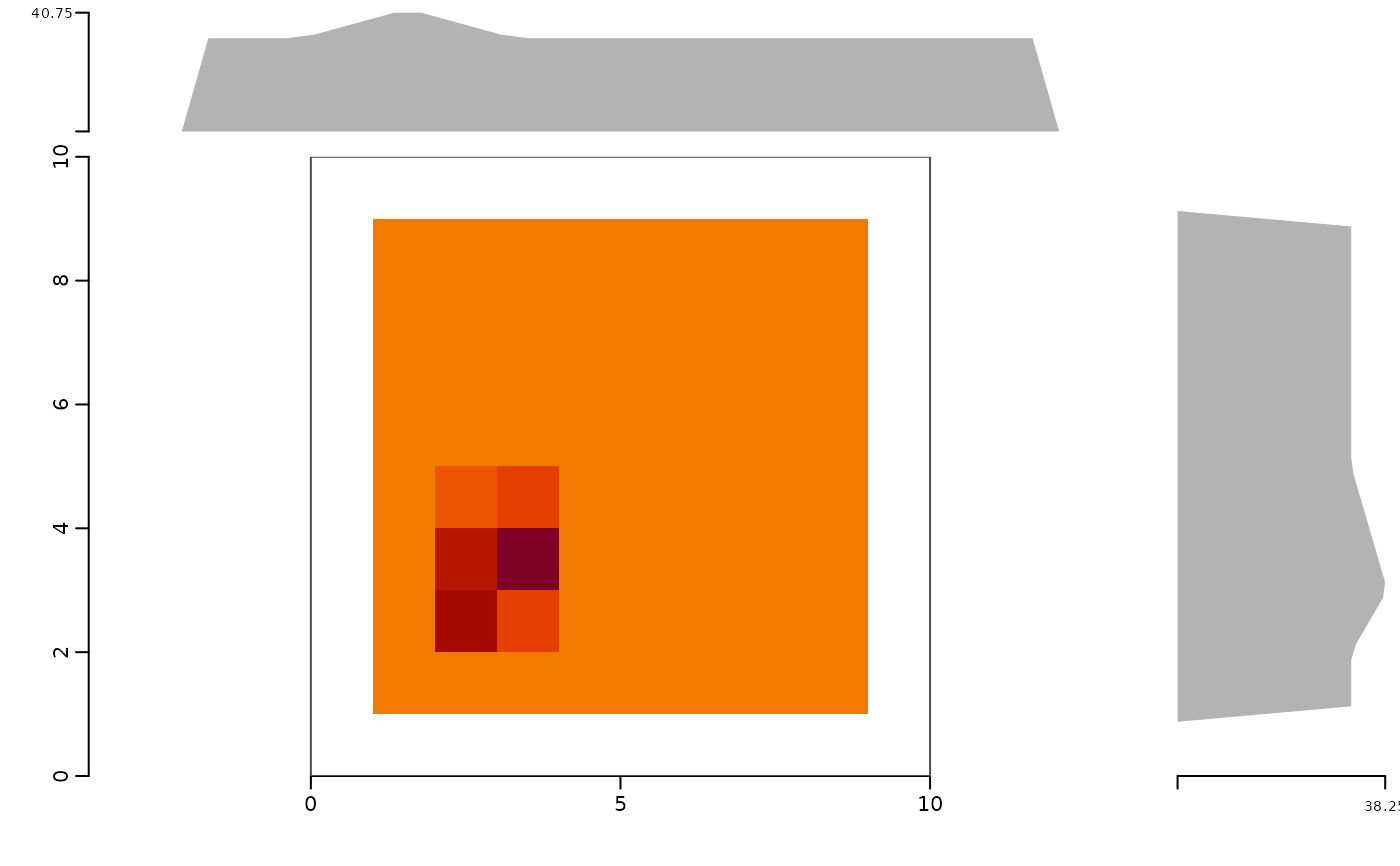
"overview"the coarse mean-coverage matrix from
overview_burn()drawn withximage::ximage(). Cost does not depend on grid size.
"auto" (default) picks "exact" when the total record count is at
most threshold, else "overview". Either way the optional marginal
strips are exact: covered cells per grid row (right) and per grid
column (top), from summary.controlledburn().
Examples
if (requireNamespace("geos", quietly = TRUE)) {
  poly <- geos::as_geos_geometry(c("POLYGON ((1 1, 9 1, 9 9, 1 9, 1 1))",
                                   "POLYGON ((2 2, 4 3, 3 5, 2 2))"))
  r <- burn(poly, extent = c(0, 10, 0, 10), dimension = c(40L, 40L))
  plot(r)
  plot(r, by_id = TRUE, marginals = FALSE)
  plot(r, what = "overview", tiles = 10)
}