Create a raster-like grid of Tissot distortion metrics in the target
projection. The grid is laid out in projected coordinates, back-projected
to longitude/latitude, and passed through tissot(). Returns a list of
matrices compatible with image() and easily converted to raster objects
(e.g. via terra::rast()).
Usage
tissot_raster(
  target,
  extent = NULL,
  radius = 2e+07,
  nx = 100L,
  ny = NULL,
  metrics = c("scale_area", "angle_deformation", "scale_h", "scale_k"),
  ...,
  source = "EPSG:4326"
)

# S3 method for class 'tissot_raster'
image(x, metric = NULL, col = NULL, asp = 1, main = NULL, ...)

# S3 method for class 'tissot_raster'
plot(x, ...)
Arguments
- target
target projection CRS string
- extent
numeric length 4:
c(xmin, xmax, ymin, ymax)in projected coordinates. IfNULL(default), estimated from the global lonlat bounding box (clamped byradius).- radius
maximum half-width of the grid extent in projected units (default
2e7). The auto-detected extent is clamped so that no dimension exceeds2 * radius. Prevents blow-up for projections like stereographic or gnomonic that map the whole globe to huge coordinates. Ignored ifextentis supplied.- nx
integer; number of grid cells in x (default 100)
- ny
integer; number of grid cells in y. If
NULL, set to maintain approximately square cells.- metrics
character vector of column names from
tissot()output to include as layers. Default includes areal scale, angular deformation, and meridional/parallel scale factors.- ...
passed to
image()- source
source CRS (default
"EPSG:4326")- x
a
tissot_raster(fromtissot_raster())- metric
which metric to plot (default: first available)
- col
colour palette (default:
hcl.colors(64, "YlOrRd", rev = TRUE))- asp
aspect ratio (default 1)
- main
plot title (default: metric name)
Value
A tissot_raster list with components:
xnumeric vector of x (easting) cell centers
ynumeric vector of y (northing) cell centers
znamed list of
ny x nxmatrices, one per metrictargetthe target CRS string
extentthe
c(xmin, xmax, ymin, ymax)used
The object has an image() method for quick plotting.
Details
If extent is NULL, the function samples a dense set of boundary
coordinates spanning \([-180, 180] \times [-85, 85]\) (longitude/latitude), projects them into the target CRS, and uses
the resulting bounding range (padded by 5%) as the grid extent.
See also
tissot(), plot.tissot_raster(), image.tissot_raster()
Examples
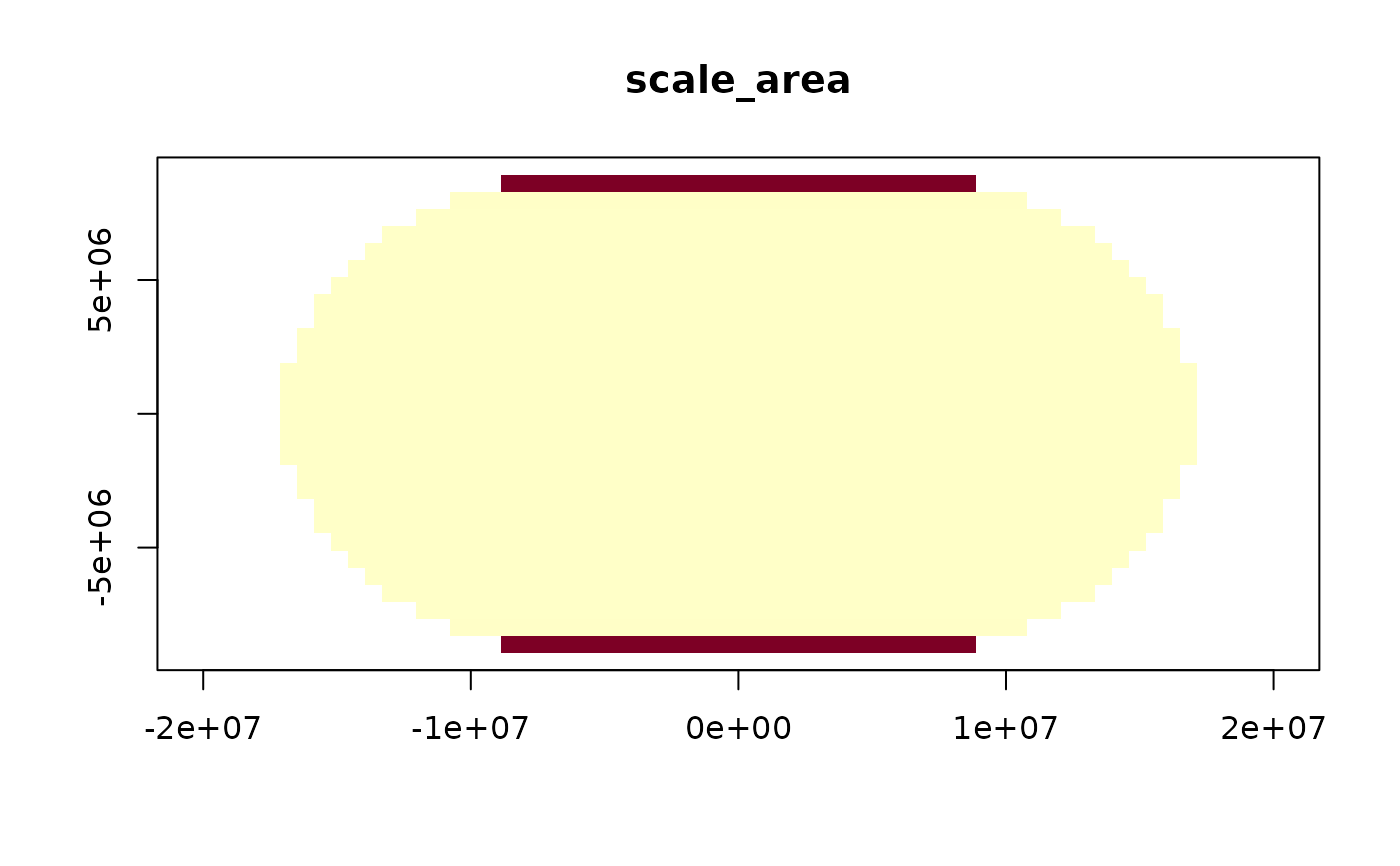
tr <- tissot_raster("+proj=robin", nx = 60)
image(tr)
 ## specific metric
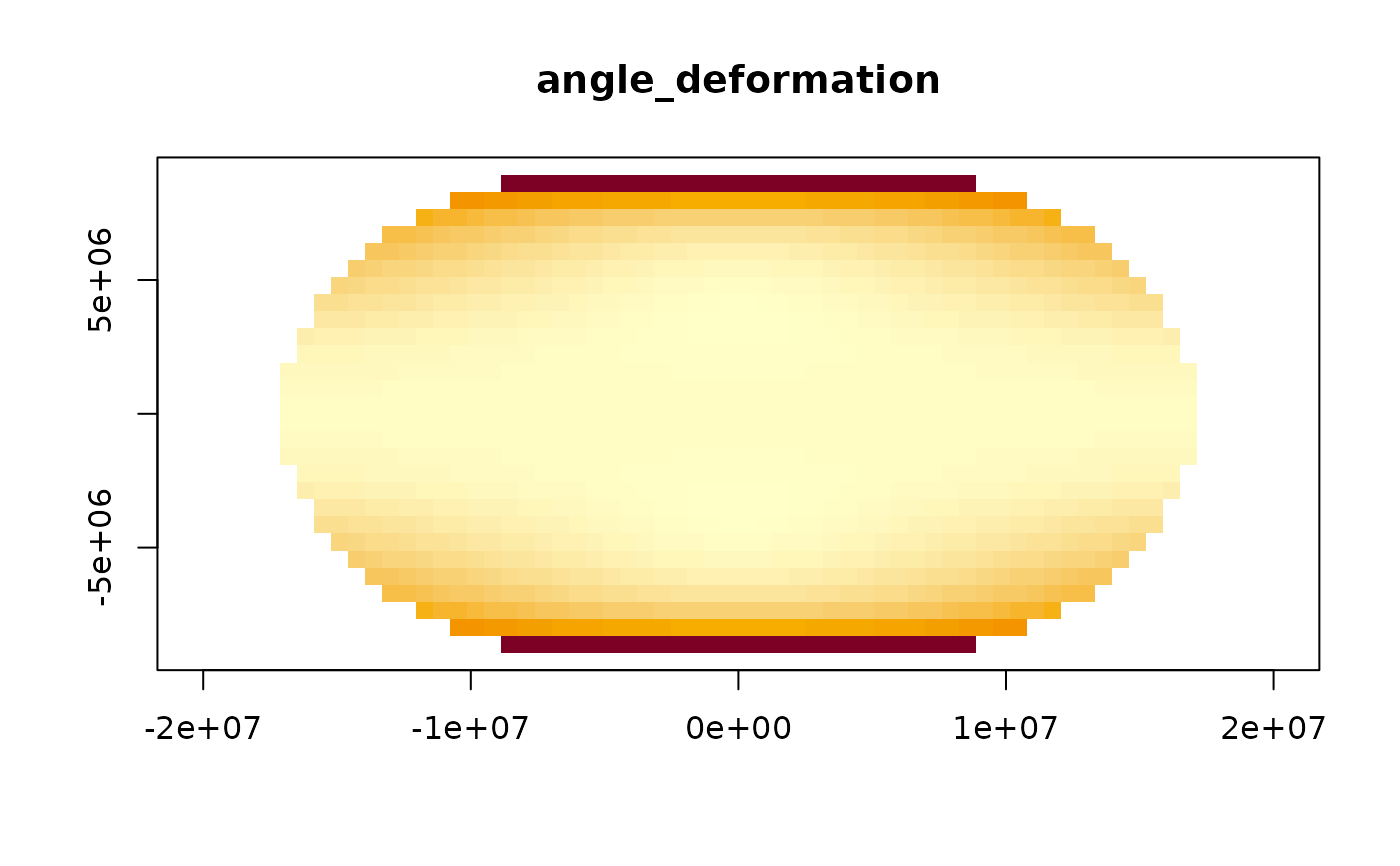
image(tr, metric = "angle_deformation")
## specific metric
image(tr, metric = "angle_deformation")
 ## with coastline overlay
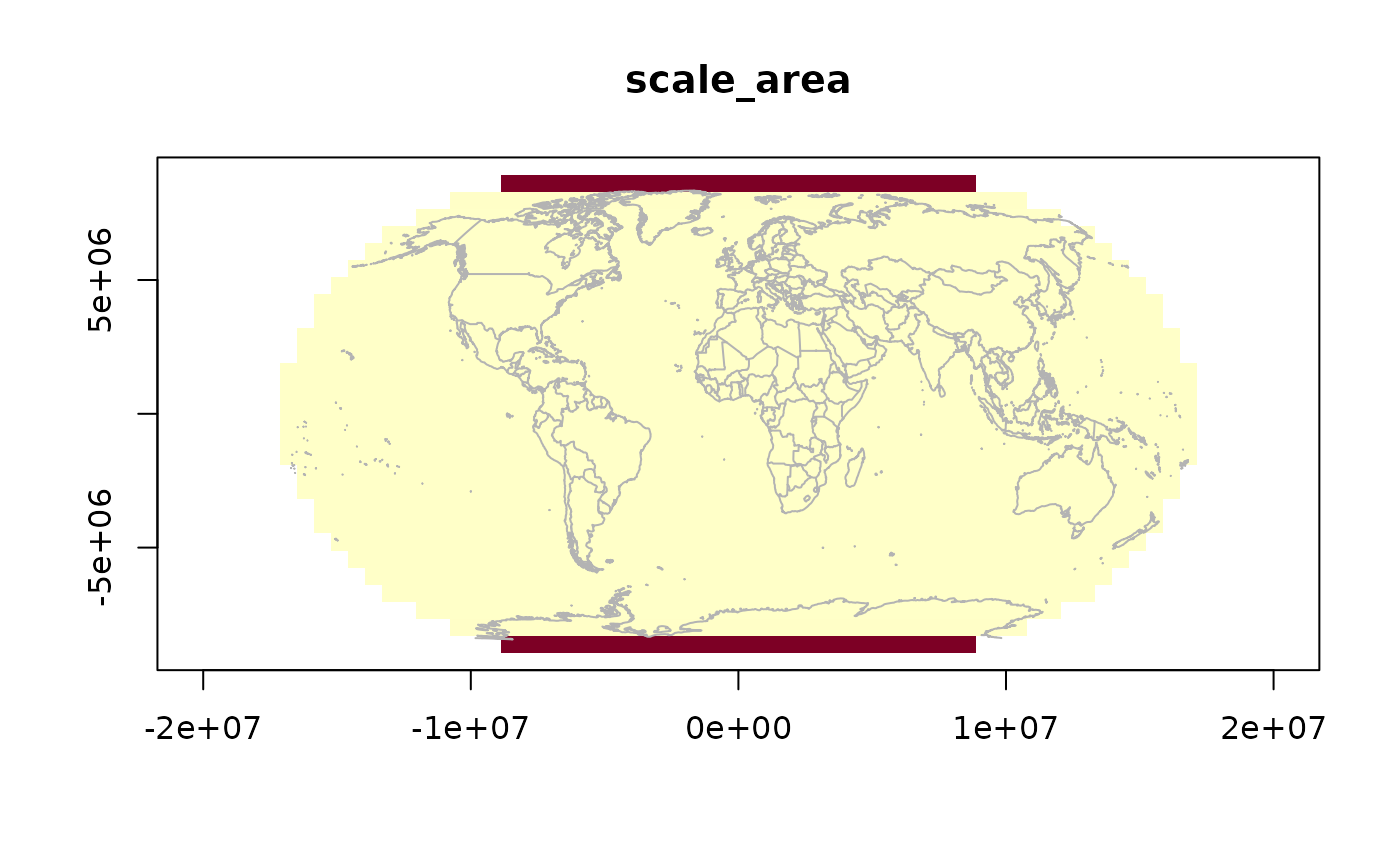
image(tr)
tissot_map()
## with coastline overlay
image(tr)
tissot_map()
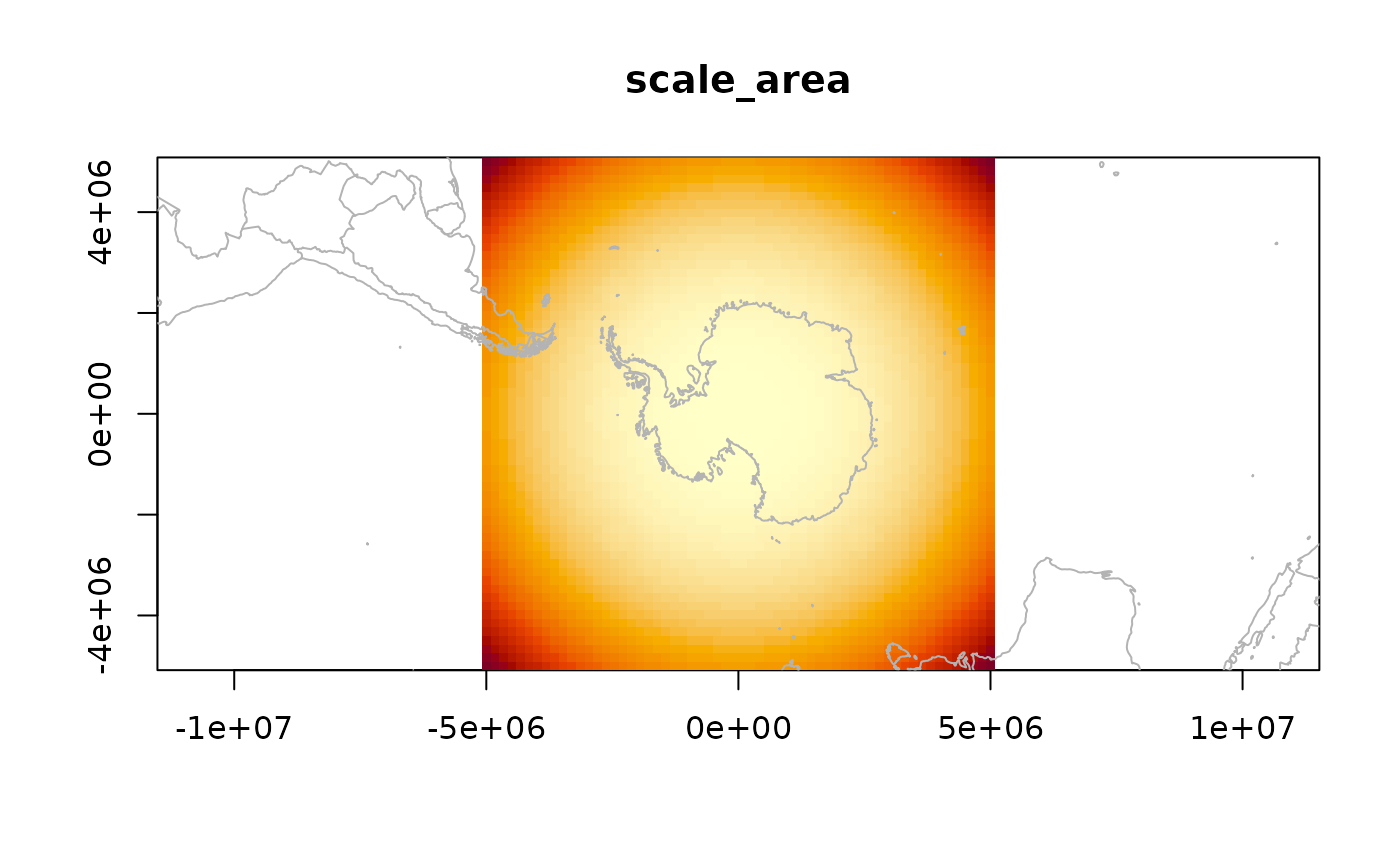
 ## polar stereo — use radius to cap extent
tp <- tissot_raster("+proj=stere +lat_0=-90", radius = 5e6, nx = 60)
image(tp)
tissot_map()
## polar stereo — use radius to cap extent
tp <- tissot_raster("+proj=stere +lat_0=-90", radius = 5e6, nx = 60)
image(tp)
tissot_map()