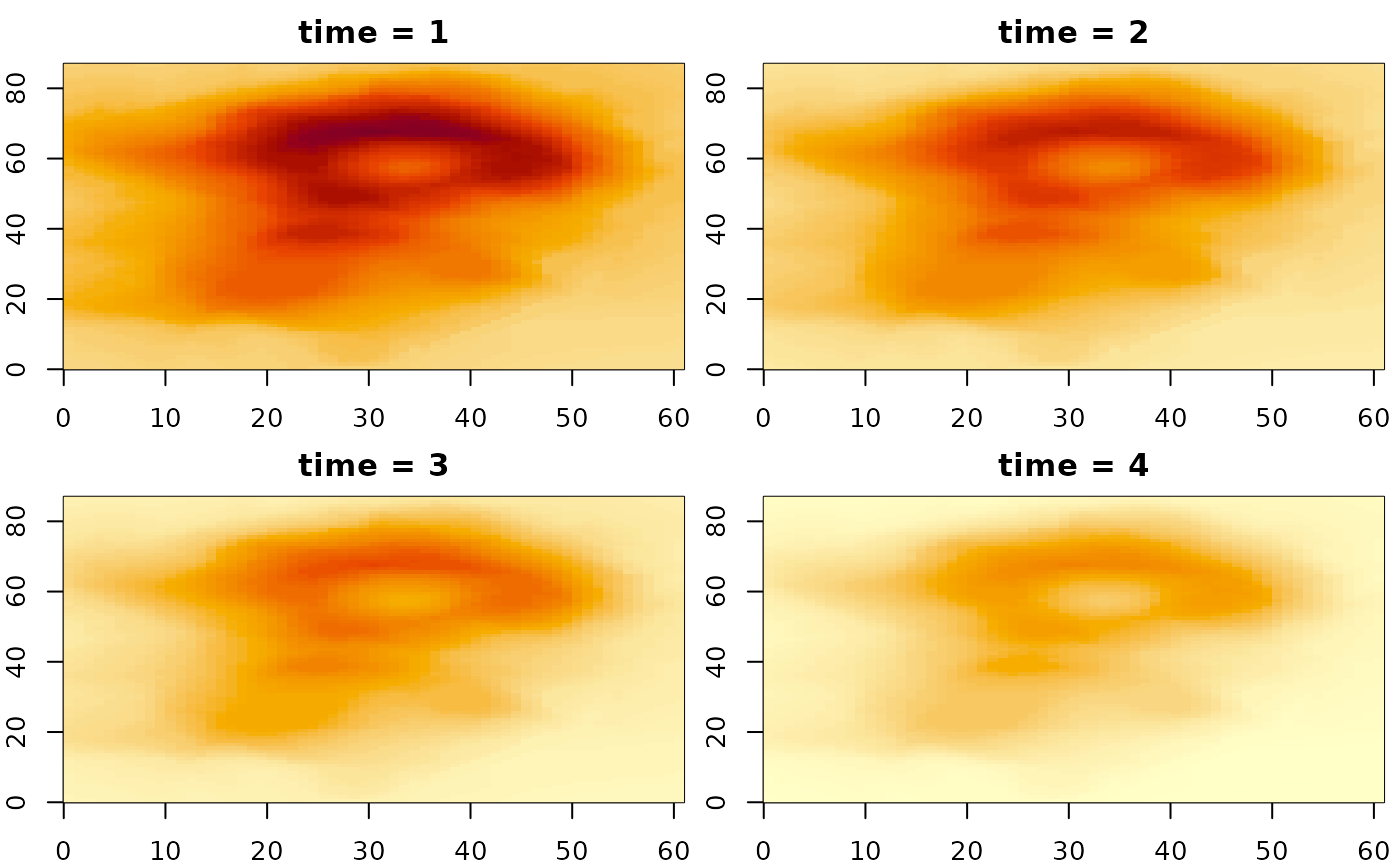
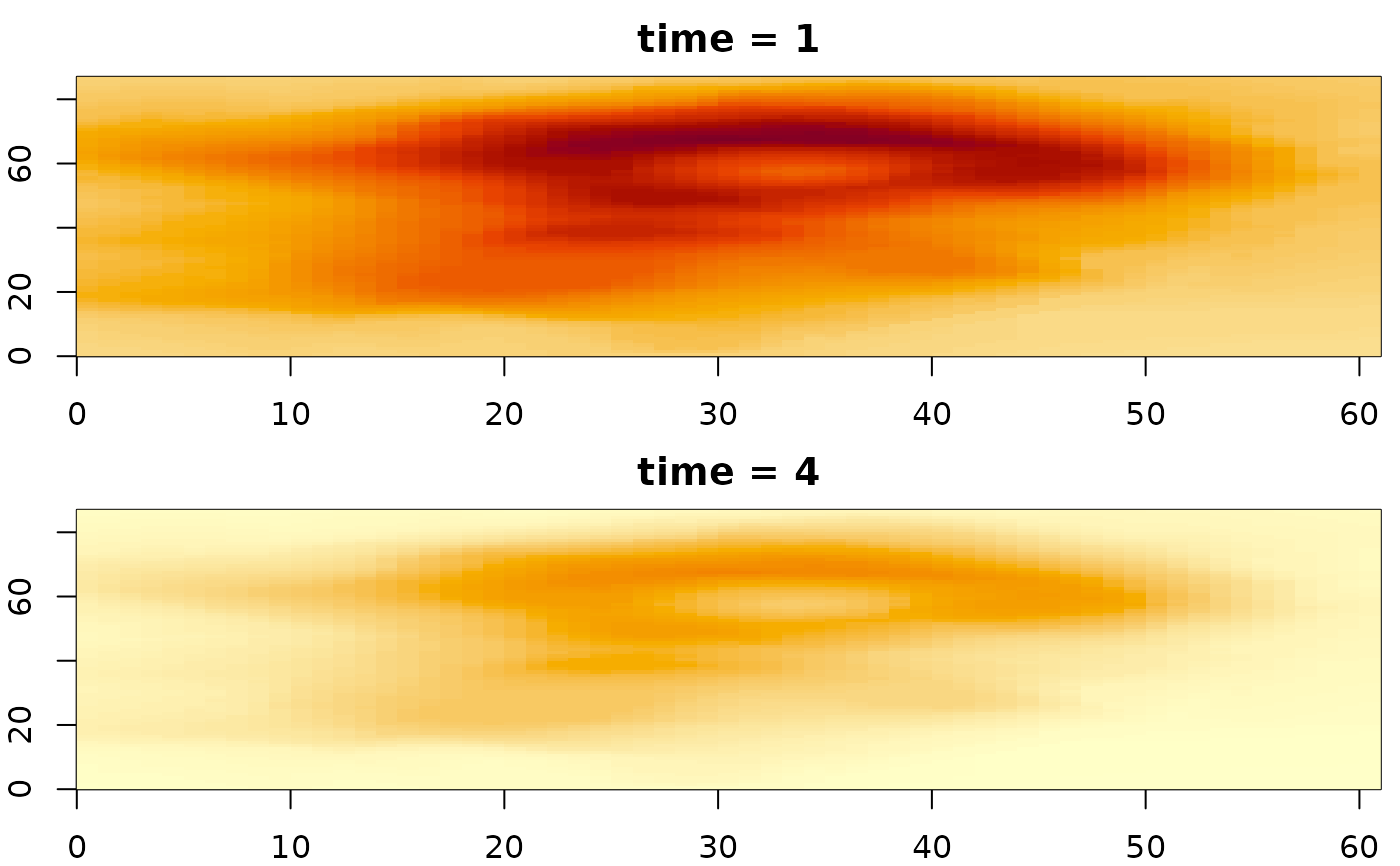
xslices() lists the slices of an array that ximage() can draw: one
row per combination of the non-spatial dimensions, with a column of
indices for each and a "_label" column with its coordinate value where
known. Only metadata is read. A row can be given to slice in ximage()
and friends.
Usage
xslices(x, xy = NULL)

xpanels(
  x,
  slice = NULL,
  ...,
  zlim = NULL,
  xy = NULL,
  coords = NULL,
  col = hcl.colors(96, "YlOrRd", rev = TRUE),
  breaks = NULL,
  alpha = NULL,
  na.col = "transparent",
  main = NULL,
  mfrow = NULL,
  max_panels = 16L
)
Arguments
- x
an array, or anything
ximage()accepts- xy
the two spatial dimensions, x then y, as names or positions
- slice
slices to draw, see Details
- ...
passed to plot for each panel
- zlim
optional, absolute range of data to map colours to (maintains comparable colours across plots); values outside display as 'na.col'; single-band numeric data only
- coords
optional coordinates of the spatial dimensions,
list(x = , y = )of centres, edges, or curvilinear matrices (see Details)- col
colours to map single-band data to
- breaks
a set of finite numeric breakpoints for the colours, one more break than colour (if not, colours are interpolated to fit)
- alpha
optional constant opacity in
[0, 1](or vector/matrix, recycled) applied on top of any existing alpha channel; not supported for nativeRaster input- na.col
colour for missing values, default "transparent"
- main
panel titles, default from the slice and its label
- mfrow
panel layout, default from
grDevices::n2mfrow()- max_panels
the most panels drawn by default
Value
xslices() a data frame (with zero columns for data with no
dimensions to slice); xpanels() invisibly, a list of what ximage()
returns for each panel and the 'zlim' used
Details
xpanels() draws several slices side by side with one colour scale (the
range of all the slices drawn, unless 'zlim' or 'breaks' is given), each
titled by its slice. Give the slices as a list with several indices along
one dimension, e.g. list(time = 1:6), or as rows of xslices() output.
The default is the first slices along the first non-spatial dimension.