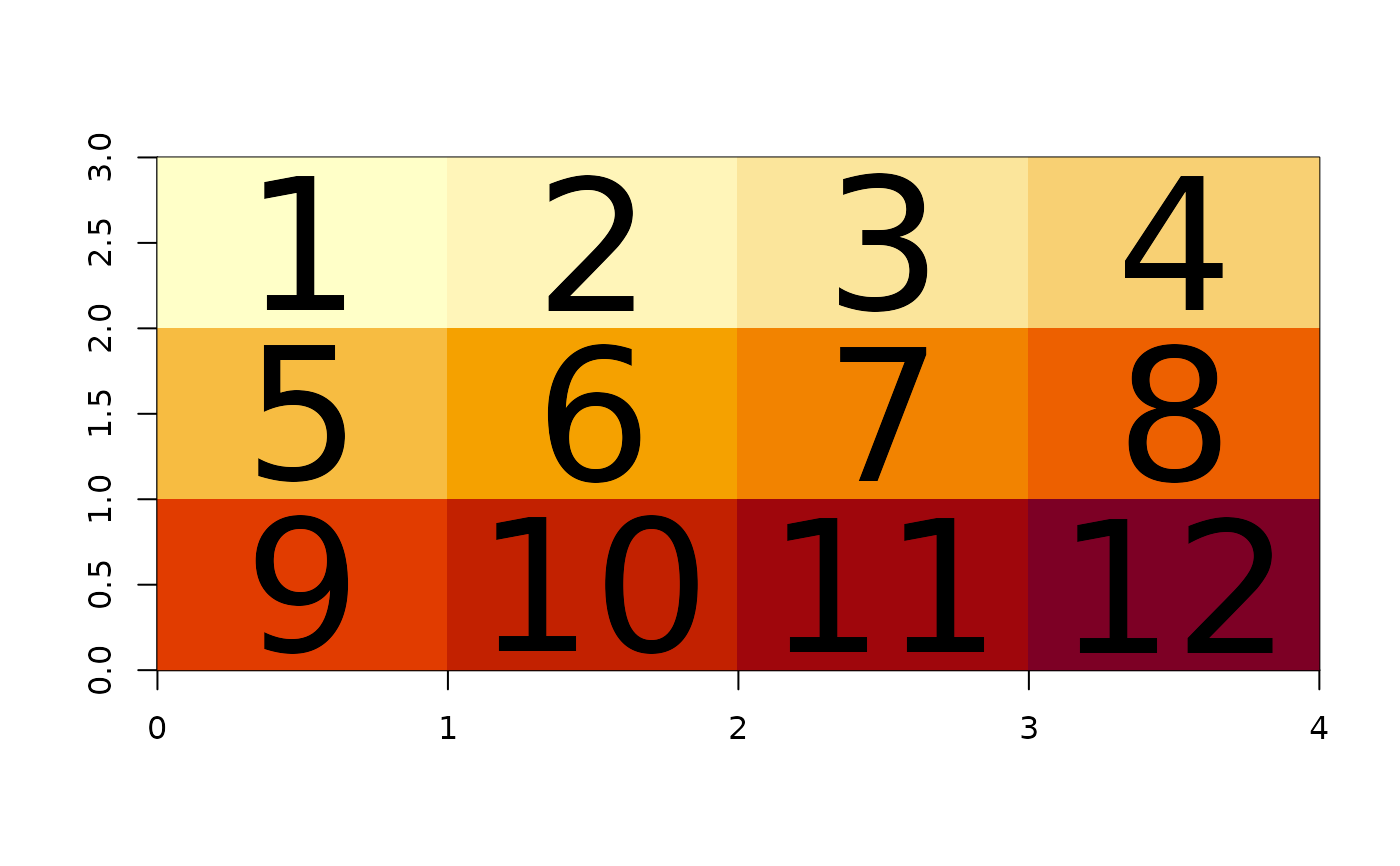
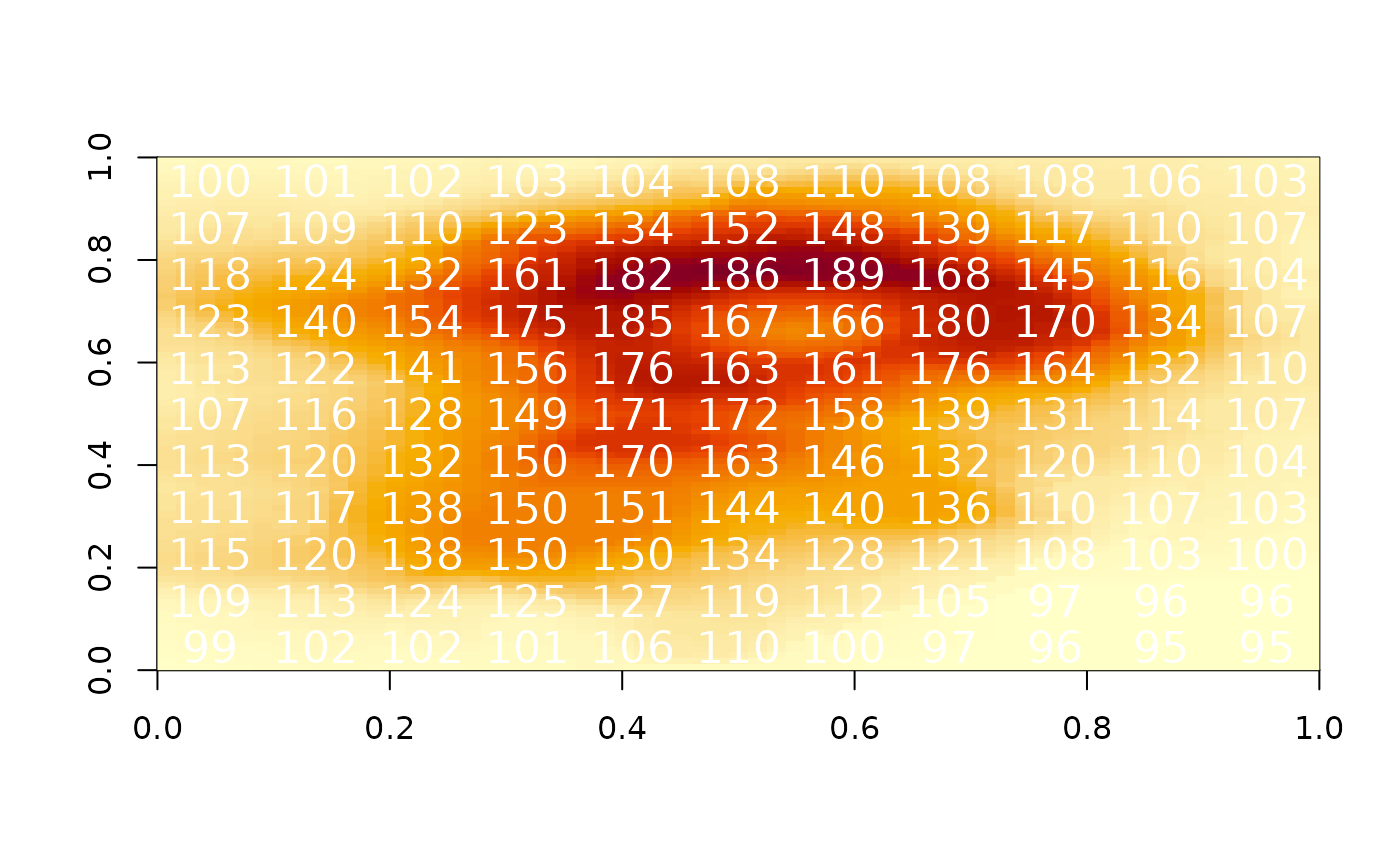
Draw the values of a matrix as text labels, each at the centre of its cell
in the same layout used by ximage(). The first cell of the matrix is the
top-left label, and each row of the matrix is a line of labels reading
left to right down the page ("raster order").
Arguments
- x
a matrix of values to draw as labels, or a reader-output list
- extent
optional, numeric xmin,xmax,ymin,ymax (defaults to the 0,ncol 0,nrow index space of the matrix)
- add
add to plot, or start afresh
- cex
text size, computed to fit the cells if not supplied
- fit
fraction of the cell the largest label should occupy when 'cex' is computed, default 0.9
- ...
arguments passed to
text(), for example 'col'
Details
Text size is chosen automatically to fit the largest label within a cell, scaled by 'fit' (use 'cex' to override). Labels that are NA are not drawn.
Input may be a matrix (values are used as labels via format()), or a
list in the style of vapour or gdalraster reader output (a row-major
vector with 'dimension'/'extent' attributes, or a 'gis' attribute).