Fit a variogram to the data, then use it to weight the input values for every cell.
Usage
grid_kriging(
  x,
  value = NULL,
  grid = NULL,
  model = NULL,
  statistic = c("prediction", "se"),
  ...
)
Arguments
- x
coordinates, or coordinates carrying their value as z; see
xyz_input()- value
one value per coordinate, or
NULLto use the z ofx- grid
a
grid_spec()to interpolate onto, orNULLfor a default one- model
a
variogramModelfromgstat::vgm()to fit, orNULLfor a spherical starting guess- statistic
"prediction"for the kriged surface,"se"for the square root of the kriging variance- ...
passed to
gstat::krige()
Details
The variogram is a picture of how much two values differ, as a function of
how far apart they are. Kriging fits a curve to that picture and uses it to
choose the weights, so unlike grid_idw() the weighting is estimated from
the data rather than chosen.
That also makes this the one method here that can refuse. If the values have no spatial structure at these distances there is no curve to fit, the fit comes back with a negative range, and this stops rather than kriging from nonsense. Every other method in the package will happily interpolate pure noise and hand you a picture of it.
Because there is a fitted model, there is also a variance: statistic = "se"
returns the square root of the kriging variance, which is small near the data
and rises to the sill away from it. That surface is usually more informative
than the prediction, and it is the reason to reach for this method at all.
model is passed to gstat::fit.variogram() as the starting point. The
default is a spherical model with the sill at the overall variance and the
range at a third of the distances the variogram covers. That is a starting
guess, not an analysis: a real one plots gstat::variogram() first and
chooses. If the fit does not converge, that is what it is telling you.
Examples
xy <- cbind(runif(80), runif(80))
v <- xy[, 1] * 3 + rnorm(80, sd = 0.1)
if (requireNamespace("gstat", quietly = TRUE)) {
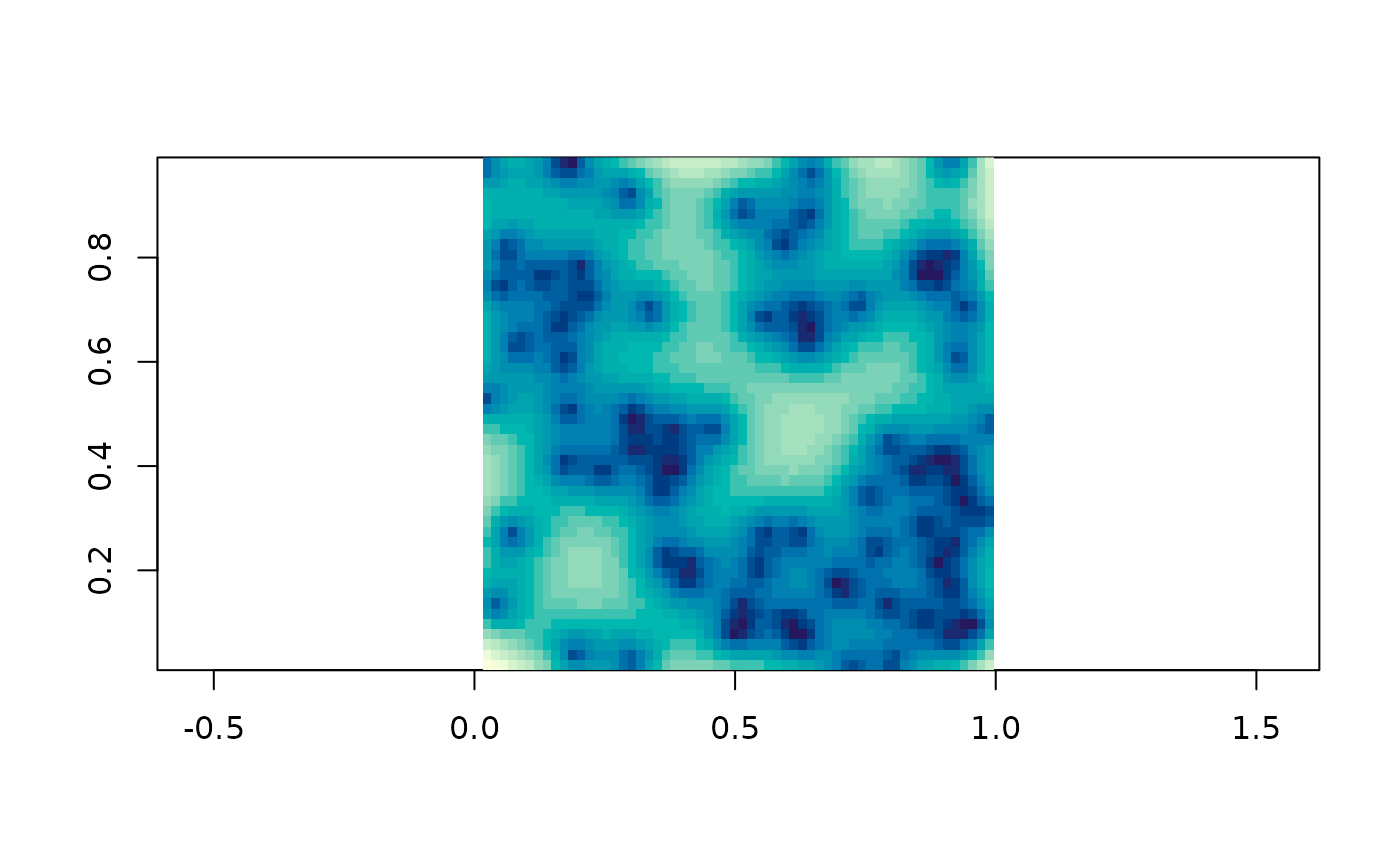
plot(grid_kriging(xy, v))
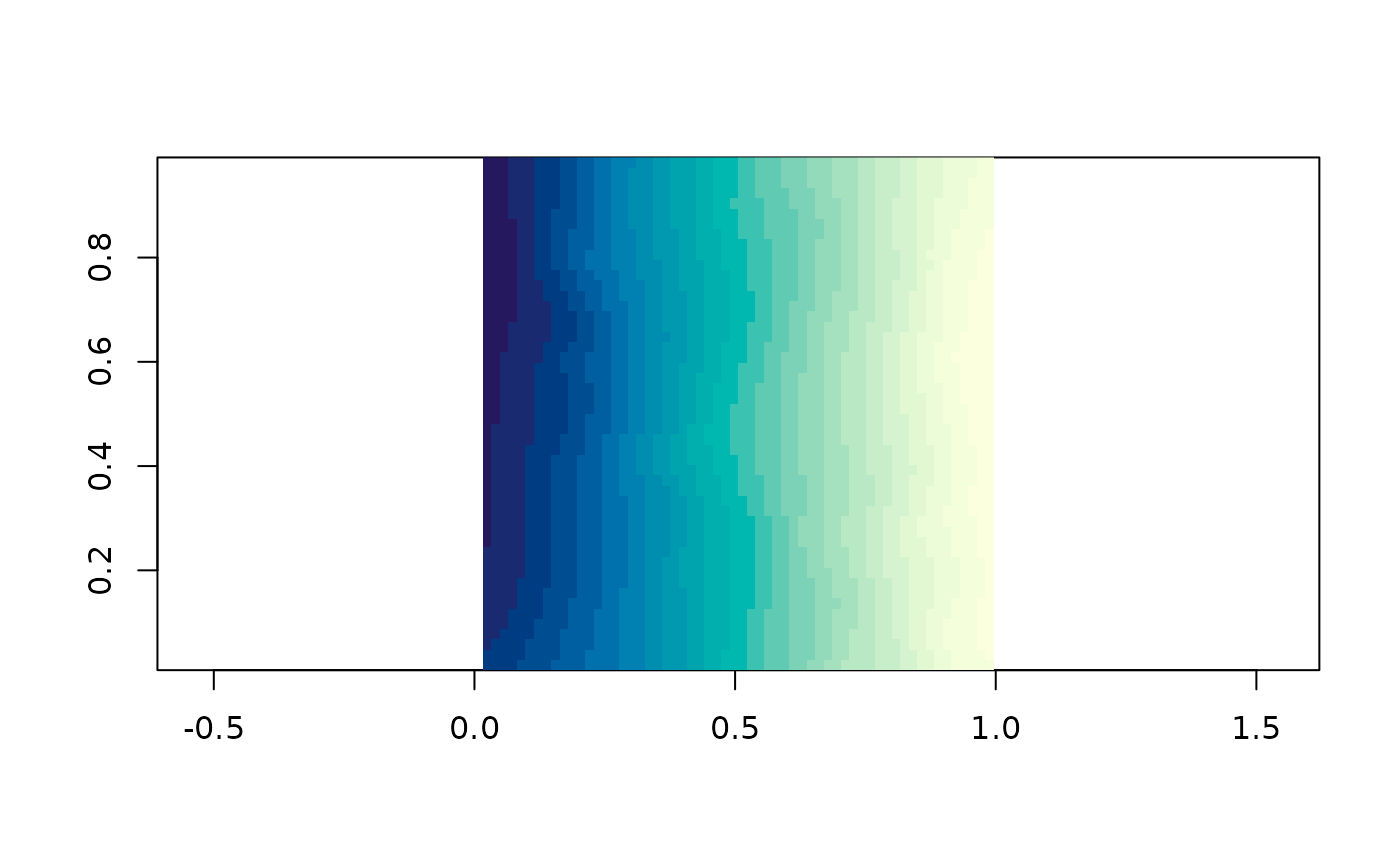
plot(grid_kriging(xy, v, statistic = "se"))
}
#> Warning: No convergence after 200 iterations: try different initial values?
 #> Warning: No convergence after 200 iterations: try different initial values?