Estimate each cell as a weighted average of the input values, weighted by
one over distance to the power idp.
Arguments
- x
coordinates, or coordinates carrying their value as z; see
xyz_input()- value
one value per coordinate, or
NULLto use the z ofx- grid
a
grid_spec()to interpolate onto, orNULLfor a default one- idp
the inverse distance power
- nmax
use at most this many of the nearest points per cell
- ...
passed to
gstat::idw()
Details
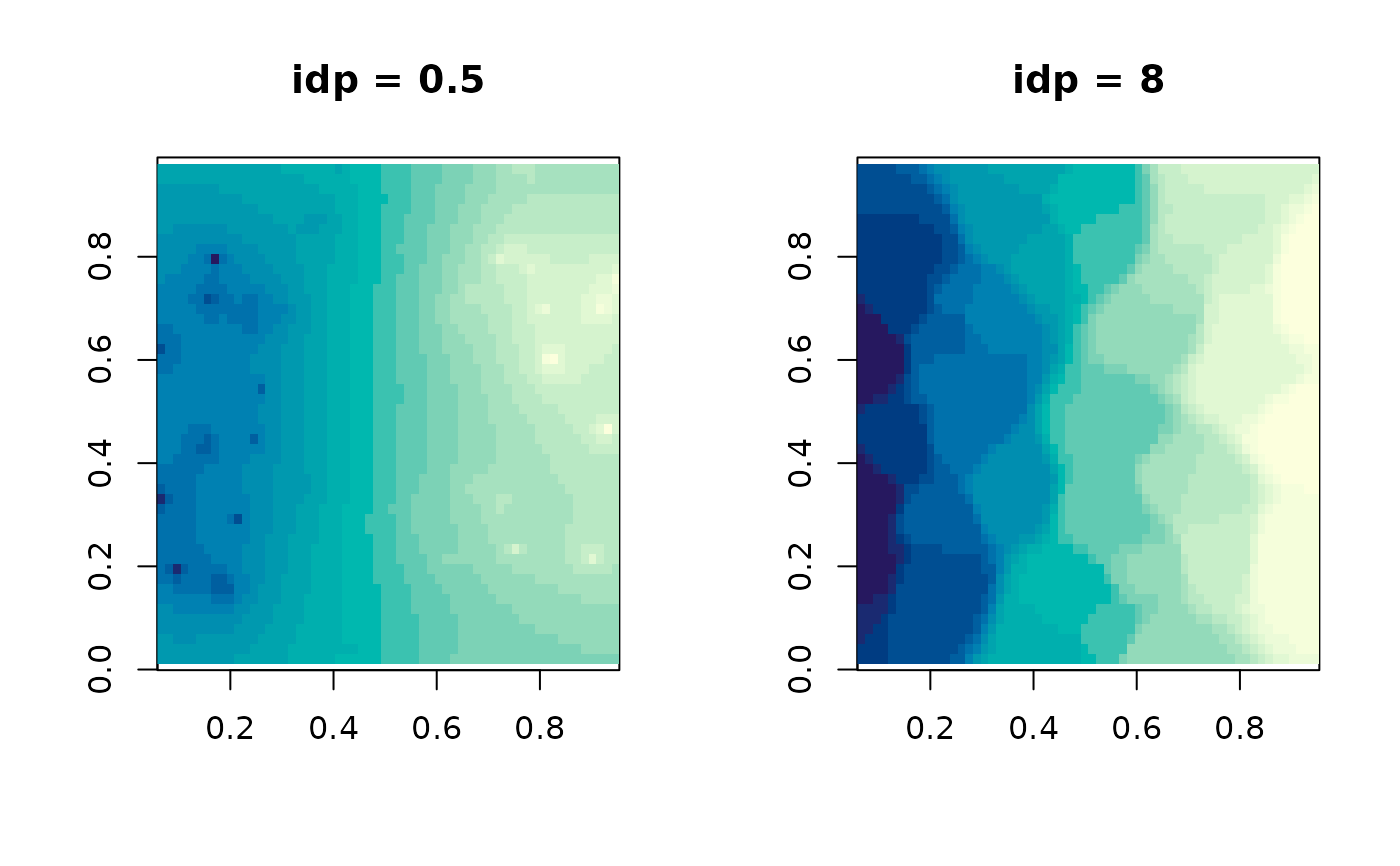
There is no model here, only a rule, and that is the point of having it next
to the others. Raising idp makes the nearest point dominate, so the
surface tends to nearest neighbour (grid_voronoi()); lowering it flattens
towards the overall mean. Neither end is more correct than the other, and
nothing in the data tells you where to sit between them.
The consequence is that this method cannot report a standard error, because
it never claimed to be estimating anything. grid_kriging() is the same
idea taken seriously: weights chosen from a fitted model of how the values
vary with distance, which then also says how uncertain each cell is.