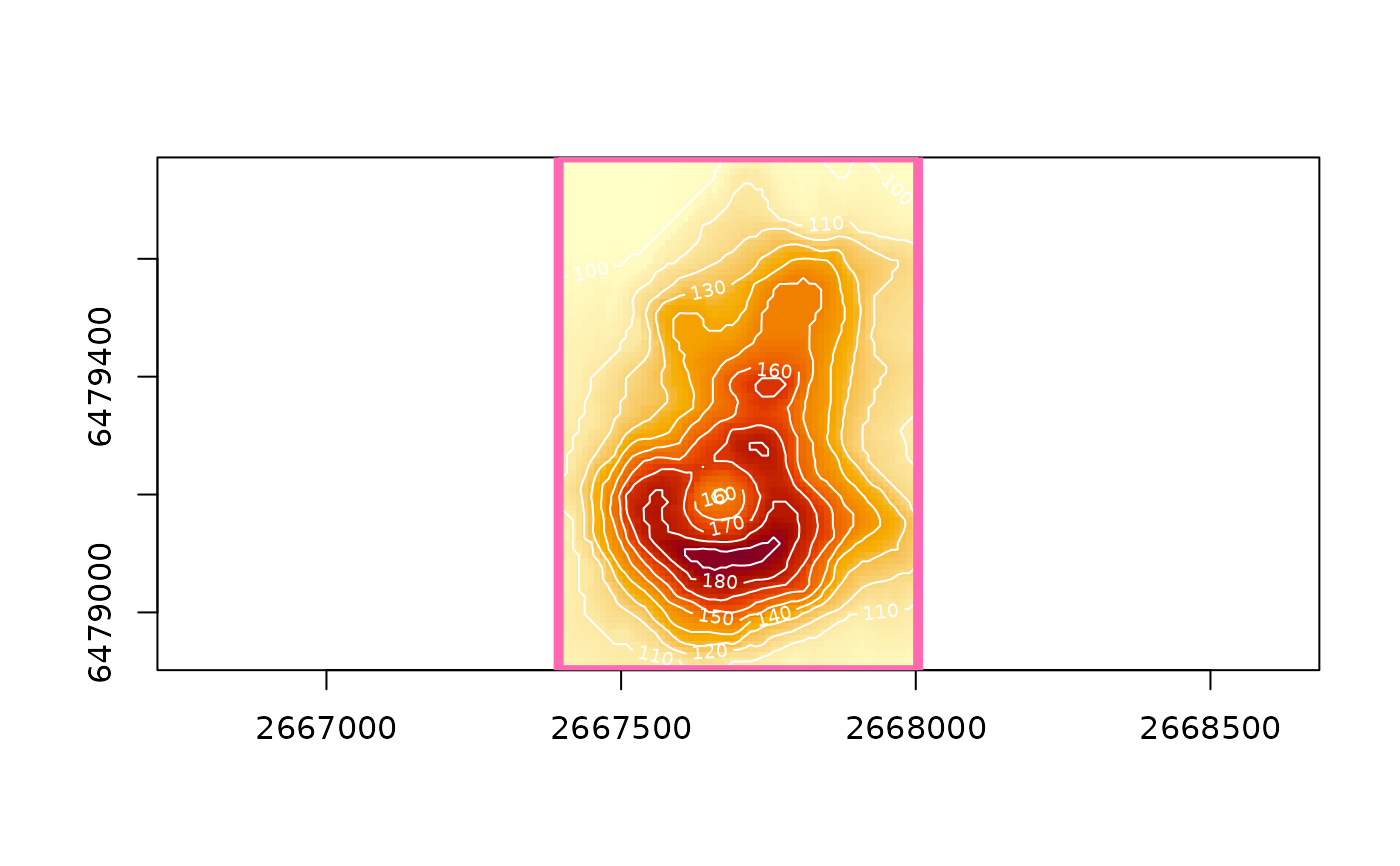
Like contour() but to work with ximage()
Arguments
- x
something we can contour
- extent
optional, numeric xmin,xmax,ymin,ymax
- ...
Arguments passed on to
ximagezlimoptional, absolute range of data to map colours to (maintains comparable colours across plots); values outside display as 'na.col'; single-band numeric data only
xlabx axis label, empty by default
ylaby axis label, empty by default
colcolours to map single-band data to
breaksa set of finite numeric breakpoints for the colours, one more break than colour (if not, colours are interpolated to fit)
alphaoptional constant opacity in
[0, 1](or vector/matrix, recycled) applied on top of any existing alpha channel; not supported for nativeRaster inputna.colcolour for missing values, default "transparent"
forceproceed with a guessed dimension for very long bare vectors (see Details), default
FALSE
- add
add to plot, or start afresh