Copernicus Marine ARCO Zarr

Zarr v2
/vsicurl/
ocean
Sea level, ocean reanalysis and SST from Copernicus Marine’s public Zarr v2 stores.

Copernicus Marine serves its products as Zarr v2 with consolidated metadata on an S3-compatible endpoint, twice over: timeChunked.zarr (one time step, a large spatial block per chunk: good for maps) and geoChunked.zarr (many time steps, a small spatial block: good for time series). The buckets refuse listing, which does not matter: the ZARR: prefix tells GDAL what it is looking at, and GDAL goes from .zmetadata to chunk keys by the Zarr spec.

The store URLs are versioned by dataset (_202411, _202311, …), and Copernicus retires old versions, so these addresses are stable until the next version of each product.

Absolute dynamic topography, ten days averaged

  • Address: ZARR:"/vsicurl/https://s3.waw3-1.cloudferro.com/mdl-arco-time-045/arco/SEALEVEL_GLO_PHY_L4_MY_008_047/cmems_obs-sl_glo_phy-ssh_my_allsat-l4-duacs-0.125deg_P1D_202411/timeChunked.zarr"
  • Provider: Copernicus Marine Service
  • Versioned: stable until the provider retires this version.
  • Status: answered the store check at 2026-11-01 09:15 UTC.
dsn = ('ZARR:"/vsicurl/https://s3.waw3-1.cloudferro.com/mdl-arco-time-045/arco/'
       'SEALEVEL_GLO_PHY_L4_MY_008_047/cmems_obs-sl_glo_phy-ssh_my_allsat-l4-duacs-0.125deg_P1D_202411/'
       'timeChunked.zarr"')
if live("cmems-sla"):
    sl = xr.open_dataset(dsn, engine="gdalxarray")
    print(list(sl.data_vars), dict(sl.sizes))
['adt', 'err_sla', 'err_ugosa', 'err_vgosa', 'flag_ice', 'sla', 'tpa_correction', 'ugos', 'ugosa', 'vgos', 'vgosa'] {'latitude': 1440, 'longitude': 2880, 'time': 12188, 'nv': 2}
if live("cmems-sla"):
    adt = (sl["adt"].sel(time=slice("2024-06-01", "2024-06-10"),
                         latitude=slice(-48, -25), longitude=slice(145, 170))
           .mean("time"))
    fig, ax = plt.subplots(figsize=(7, 6))
    adt.plot(ax=ax, cmap="RdBu_r", robust=True)
    adt.plot.contour(ax=ax, levels=15, colors="k", linewidths=0.4)
    ax.set_aspect(1 / np.cos(np.radians(-36)))
    plt.show()

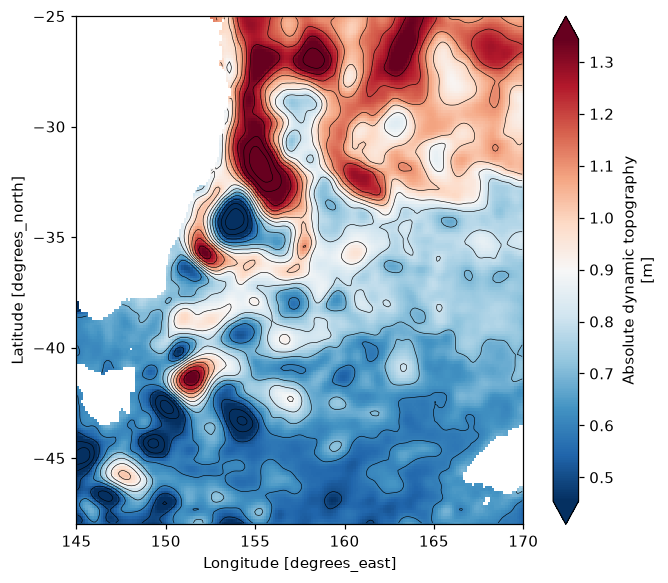
Absolute dynamic topography, mean of 1-10 June 2024, Tasman Sea. Eddies of the East Australian Current.

GLORYS12 temperature through the water column

  • Address: ZARR:"/vsicurl/https://s3.waw3-1.cloudferro.com/mdl-arco-time-025/arco/GLOBAL_MULTIYEAR_PHY_001_030/cmems_mod_glo_phy_my_0.083deg_P1D-m_202311/timeChunked.zarr"
  • Provider: Copernicus Marine Service
  • Versioned: stable until the provider retires this version.
  • Status: answered the store check at 2026-11-01 09:15 UTC.
dsn = ('ZARR:"/vsicurl/https://s3.waw3-1.cloudferro.com/mdl-arco-time-025/arco/'
       'GLOBAL_MULTIYEAR_PHY_001_030/cmems_mod_glo_phy_my_0.083deg_P1D-m_202311/timeChunked.zarr"')
if live("cmems-glorys"):
    gl = xr.open_dataset(dsn, engine="gdalxarray")
    print(dict(gl["thetao"].sizes))
    print("elevation (m):", gl["elevation"].values[[0, -1]])
{'time': 12318, 'elevation': 50, 'latitude': 2041, 'longitude': 4320}
elevation (m): [-5.727917e+03 -4.940250e-01]

The ARCO stores name the vertical axis elevation, not depth as the original netCDF does; the values printed above show its sign and order. The cells below select by distance from the surface, so they work whichever way the axis runs.

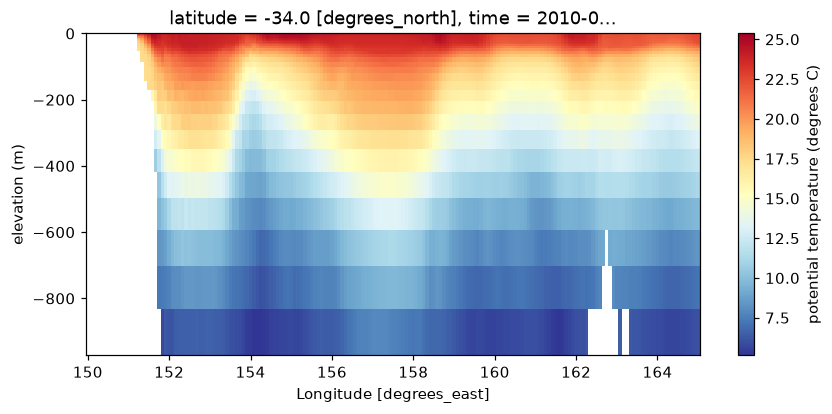
A zonal section along 34S, from the coast across the current, on one day:

if live("cmems-glorys"):
    z = gl["elevation"]
    upper = z[np.abs(z) <= 1000]                      # the upper 1000 m, either order
    sec = (gl["thetao"].sel(time="2010-01-15").sel(latitude=-34, method="nearest")
           .sel(longitude=slice(150, 165), elevation=upper))
    fig, ax = plt.subplots(figsize=(9, 3.8))
    sec.plot(ax=ax, x="longitude", y="elevation", cmap="RdYlBu_r",
             cbar_kwargs={"label": "potential temperature (degrees C)"})
    ax.set_ylabel("elevation (m)")
    plt.show()

GLORYS12 potential temperature on a section along 34S, upper 1000 m, 15 January 2010.
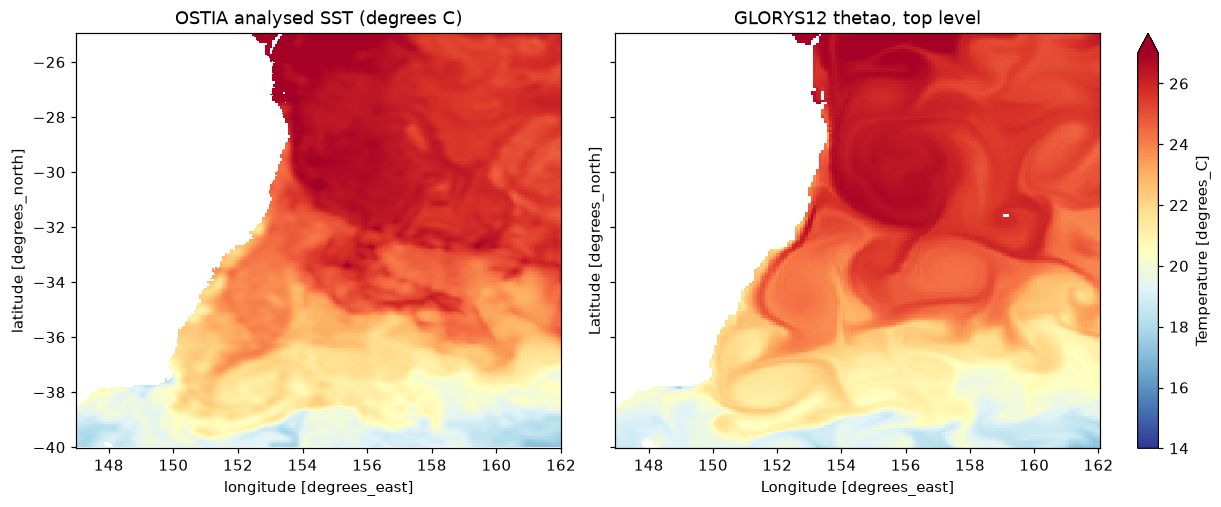
OSTIA and GLORYS surface, side by side

  • Address: ZARR:"/vsicurl/https://s3.waw3-1.cloudferro.com/mdl-arco-time-046/arco/SST_GLO_SST_L4_REP_OBSERVATIONS_010_011/METOFFICE-GLO-SST-L4-REP-OBS-SST_202003/timeChunked.zarr"
  • Provider: Copernicus Marine Service
  • Versioned: stable until the provider retires this version.
  • Status: answered the store check at 2026-11-01 09:15 UTC.
dsn = ('ZARR:"/vsicurl/https://s3.waw3-1.cloudferro.com/mdl-arco-time-046/arco/'
       'SST_GLO_SST_L4_REP_OBSERVATIONS_010_011/METOFFICE-GLO-SST-L4-REP-OBS-SST_202003/'
       'timeChunked.zarr"')
if live("cmems-ostia") and live("cmems-glorys"):
    os_ = xr.open_dataset(dsn, engine="gdalxarray")
    box = dict(latitude=slice(-40, -25), longitude=slice(147, 162))
    a = (os_["analysed_sst"].sel(time="2010-01-15").sel(**box) - 273.15).squeeze()
    top = int(np.argmin(np.abs(gl["elevation"].values)))   # level nearest the surface
    b = gl["thetao"].sel(time="2010-01-15").isel(elevation=top).sel(**box).squeeze()
    fig, axs = plt.subplots(1, 2, figsize=(11, 4.5), sharey=True, layout="constrained")
    a.plot(ax=axs[0], cmap="RdYlBu_r", vmin=14, vmax=27, add_colorbar=False)
    b.plot(ax=axs[1], cmap="RdYlBu_r", vmin=14, vmax=27)
    axs[0].set_title("OSTIA analysed SST (degrees C)"); axs[1].set_title("GLORYS12 thetao, top level")
    plt.show()

Rendered with GDAL 3.13.3, xarray 2026.4.1.dev32+g71cfb13ac, numpy 2.5.4, gdalxarray 0.5.1, rasterix 0.2.4.