Classic rasters (bands as a dimension or as variables) and multidimensional arrays.
gdalxarray opens a source in one of two GDAL data models, chosen by multidim=:
multidim=False (classic)
multidim=True (default)
GDAL API
gdal.Open, raster bands
gdal.OpenEx(..., OF_MULTIDIM_RASTER), groups and arrays
Dimensions
(band, y, x)
whatever the source names: time, depth, lat, lon, …
Georeferencing
geotransform + CRS, as a RasterIndex and CRSIndex
coordinate arrays from the source
Natural for
GeoTIFF/COG, JPEG2000, classic VRT, warped VRT
netCDF, HDF5, Zarr, GRIB, multidim VRT, Icechunk
Classic, bands as a dimension
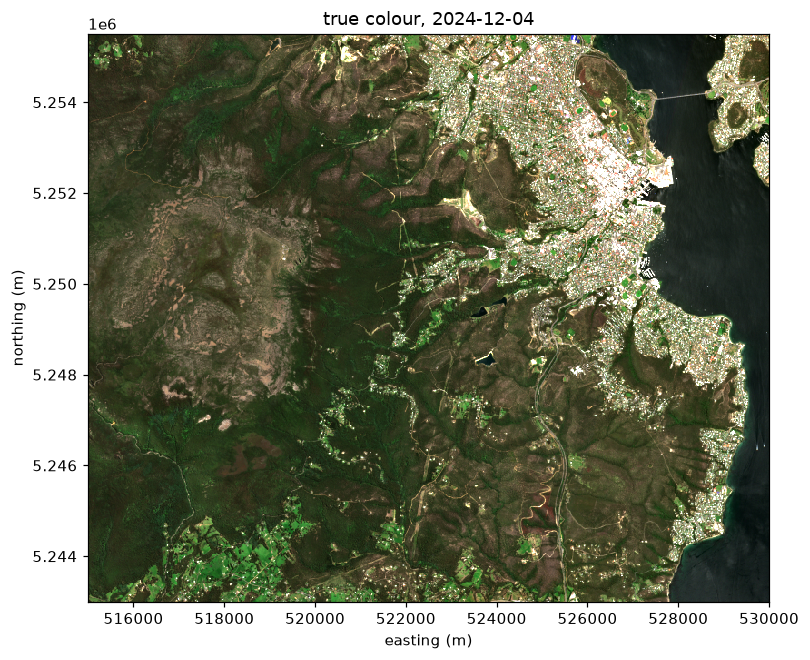
The default for multidim=False: one band_data variable with dimensions (band, y, x), the layout rioxarray uses. The example is a cloud-free Sentinel-2 summer scene over Hobart, from kunanyi / Mount Wellington to the Derwent estuary: four bands (blue, green, red, near infrared) on the scene’s own UTM zone 55S grid, averaged to 20 m.
Data: Copernicus Sentinel-2 Level-2A surface reflectance; licence: Copernicus Sentinel data terms (free and open); attribution: contains modified Copernicus Sentinel data; day 2024-12-04. Built by scripts/fixtures/make_sentinel2.py; details in docs/fixtures/sentinel2/provenance.json.
CRSIndex
<Projected CRS: EPSG:32755>
Name: WGS 84 / UTM zone 55S
Axis Info [cartesian]:
- E[east]: Easting (metre)
- N[north]: Northing (metre)
Area of Use:
- undefined
Coordinate Operation:
- name: UTM zone 55S
- method: Transverse Mercator
Datum: World Geodetic System 1984
- Ellipsoid: WGS 84
- Prime Meridian: Greenwich
The cell coordinates come from the geotransform, and the CRS rides on the crs coordinate’s index:
ds.xindexes["crs"]
CRSIndex
<Projected CRS: EPSG:32755>
Name: WGS 84 / UTM zone 55S
Axis Info [cartesian]:
- E[east]: Easting (metre)
- N[north]: Northing (metre)
Area of Use:
- undefined
Coordinate Operation:
- name: UTM zone 55S
- method: Transverse Mercator
Datum: World Geodetic System 1984
- Ellipsoid: WGS 84
- Prime Meridian: Greenwich
The bands are stored as integers with a scale and offset (Sentinel-2 L2A digital numbers); with the default mask_and_scale=True they arrive as surface reflectance, with nodata masked:
Sentinel-2 true colour (red, green, blue reflectance, stretched) over Hobart, kunanyi / Mount Wellington and the Derwent estuary.
Classic, bands as variables
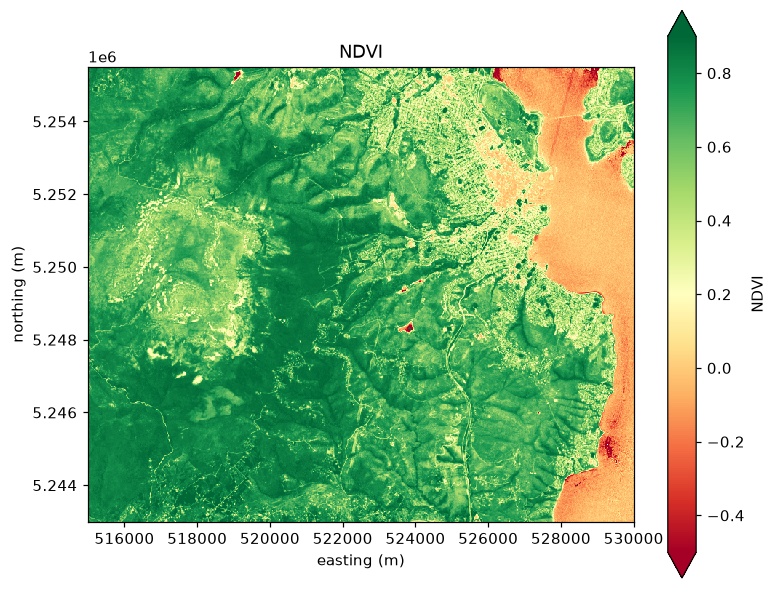
band_as_dim=False makes each band its own variable, named from the band description (or band_N when there is none). This suits rasters whose bands are different quantities, and makes band arithmetic read like the quantities it combines:
Normalised difference vegetation index, (nir - red) / (nir + red), computed from the named band variables.
Multidimensional
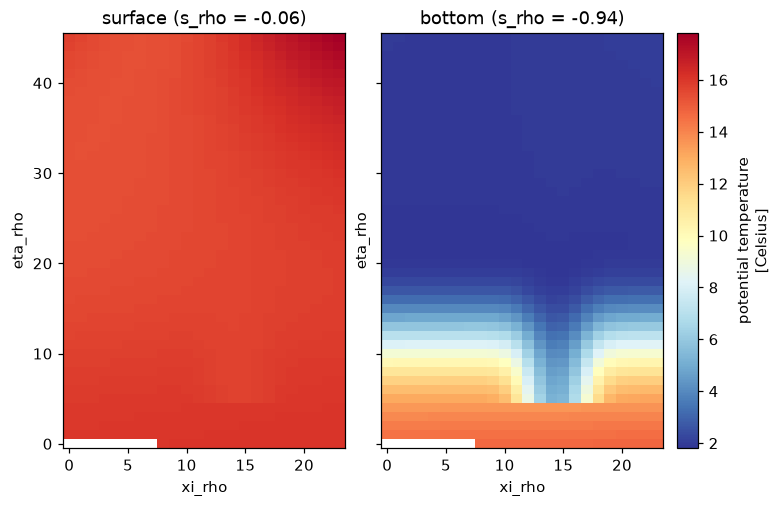
For sources with their own dimensions. The fixture below is a ROMS-style ocean model history file written as Zarr v3: a vertical s_rho axis, two index dimensions, 2D longitude and latitude arrays, and the scalar parameters of the vertical transform.
Temperature on the surface level and the deepest level of the fan grid, by index.
Placing these cells on the earth uses the 2D lon_rho and lat_rho arrays; see Curvilinear grids.
Checked against GDAL
The three Zarr fixtures in wxylib/fixtures hold the same pixels as three of the COGs, and their manifest lists windows whose values GDAL read with osgeo.gdal. gdalxarray must give the same numbers through xarray indexing, in both modes:
man = fixture_json("zarr/manifest.json")rows = []for case in man["cases"]: path = fixture("zarr/"+ case["store"]) md = xr.open_dataset(path, engine="gdalxarray", mask_and_scale=False)[case["array"]] cl = xr.open_dataset(f'ZARR:"{path}":/{case["array"]}', engine="gdalxarray", multidim=False, mask_and_scale=False)["band_data"]for w in case["windows"]: win =dict(y=slice(w["row"], w["row"] + w["height"]), x=slice(w["col"], w["col"] + w["width"])) expect = fixture_array("zarr/"+ w["file"], case["dtype"]) a = md.isel(**win).values b = cl.isel(**win).values ok_md = np.array_equal(a.ravel(), expect) ok_cl = np.array_equal(b.ravel(), expect) rows.append((case["store"], w["file"].rsplit("/", 1)[-1], a.shape, ok_md, ok_cl))assert ok_md and ok_cl, (case["store"], w["file"])import pandas as pdpd.DataFrame(rows, columns=["store", "oracle window", "shape", "multidim", "classic"])